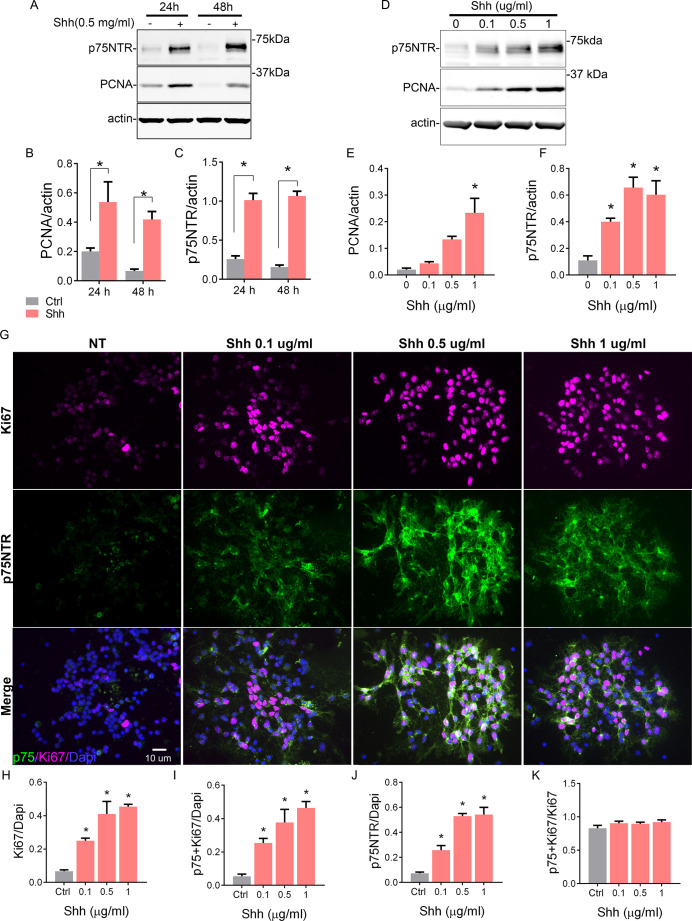
Figure 2. Shh regulates cerebellar granule neuron (CGN) proliferation and the expression of p75 neurotrophin receptor (p75NTR).
(A) Western blot analysis of the temporal and dose-dependent expression of p75NTR and PCNA (proliferation marker) in granule cell cultures exposed to Shh. (B and C) Quantification of PCNA and p75NTR expression relative to actin. Two-way ANOVA, N=4, PCNA *p=0.0006, p75NTR *p=0.0001, error bars indicate SEM. (D) Western blot analysis of the expression of p75NTR and PCNA in granule cell cultures in response to increasing concentrations of Shh for 48 hr. (E and F) Quantification of PCNA and p75NTR expression relative to actin. One-way ANOVA, N=3, PCNA *p=0.0026, p75NTR *p=0.0019, error bars indicate SEM. (G) Immunocytochemistry analysis of the expression of p75NTR (green), Ki67 (magenta), and Dapi (blue) in granule cell cultures in response to increasing concentrations of Shh for 48 hr. (H) Quantification of the total number of proliferating cells expressed as the percentage of cells expressing Ki67 over the total number of cells ANOVA, *p=0.0005, N=3, error bars indicate SEM. (I) Quantification of the number of Ki67+ p75 NTR double-labeled cells express as the number of cells expressing Ki67 and p75NTR over the total number of cells (Dapi). One-way ANOVA, N=3, *p=0.0013, error bars indicate SEM. (J) Quantification of the number of p75NTR positive cells, expressed as the number of p75NTR positive cells over the total number of cells (Dapi). One-way ANOVA, N=3, *p=0.0001, error bars indicate SEM. (K) Quantification of the number of proliferating cells that also express p75NTR, expressed as the number of double-labeled Ki67+ p75 NTR cells over the total Ki67 expressing cells. One-way ANOVA, N=3, *p=0.3346, error bars indicate SEM. All the experiments were done using cells obtained from P7 rat pups.

