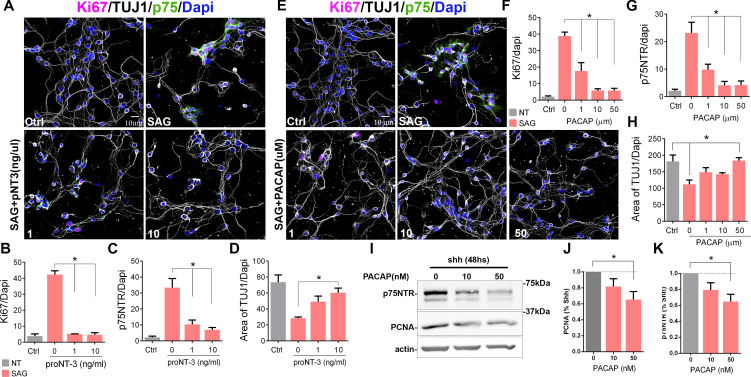
Figure 3. Cell cycle exit induced p75 neurotrophin receptor (p75NTR) downregulation.
(A) Immunocytochemistry analysis of the expression of p75NTR (green), Ki67 (magenta), βIII-tubulin (white), and Dapi (blue) in granule cell cultures obtained from P7 rat pups, in response to increasing concentrations of proNT-3 after 48 hr in culture. (B) Quantification of the number of cells expressing Ki67 over the total number of cells (Dapi). One-way ANOVA, N=4, *p=0.0001, error bars indicate SEM. (C) Quantification of the number of cells expressing p75NTR over the total number of cells (Dapi). One-way ANOVA, N=4, *p=0.0001, error bars indicate SEM. (D) Quantification of cerebellar granule cell differentiation expressed as the total area of processes positive for TUJ1 over the total number of cells (Dapi). One-way ANOVA, N=4, *p=0.0023, error bars indicate SEM. (E) Immunocytochemistry analysis of the expression of p75NTR (green), Ki67 (magenta), DCX (white), and Dapi (blue) in granule cell cultures obtained from P7 rat pups in response to increasing concentrations of PACAP after 48 hr in culture. (F) Percentage of cells expressing Ki67 over the total number of cells (Dapi). One-way ANOVA, N=4, *p=0.0001, error bars indicate SEM. (G) Percentage of cells expressing p75NTR over the total number of cells (Dapi). One-way ANOVA, N=4, *p=0.0001, error bars indicate SEM. (H) Quantification of cerebellar granule cell differentiation expressed as the total area of processes positive for DCX over the total number of cells (Dapi). One-way ANOVA, N=4, *p=0.0114, error bars indicate SEM. (I) Western blot analysis of the expression of p75NTR and PCNA in granule cell cultures obtained from P7 rat pups in response to increasing concentrations of PACAP after 48 hr in culture. (J) Quantification of PCNA expression in cerebellar granule neuron (CGN) cultures expose to PACAP and normalize to Shh alone. One-way ANOVA, N=4, *p=0.0423, error bars indicate SEM. (K) Quantification of p75NTR expression in CGN cultures expose to PACAP and normalize to Shh alone. One-way ANOVA, N=4, *p=0.0251, error bars indicate SEM. Quantification of the area of TUJ1 processes was done using a custom-built ImageJ macro. All the experiments were done using cells obtained from P7 rat pups.
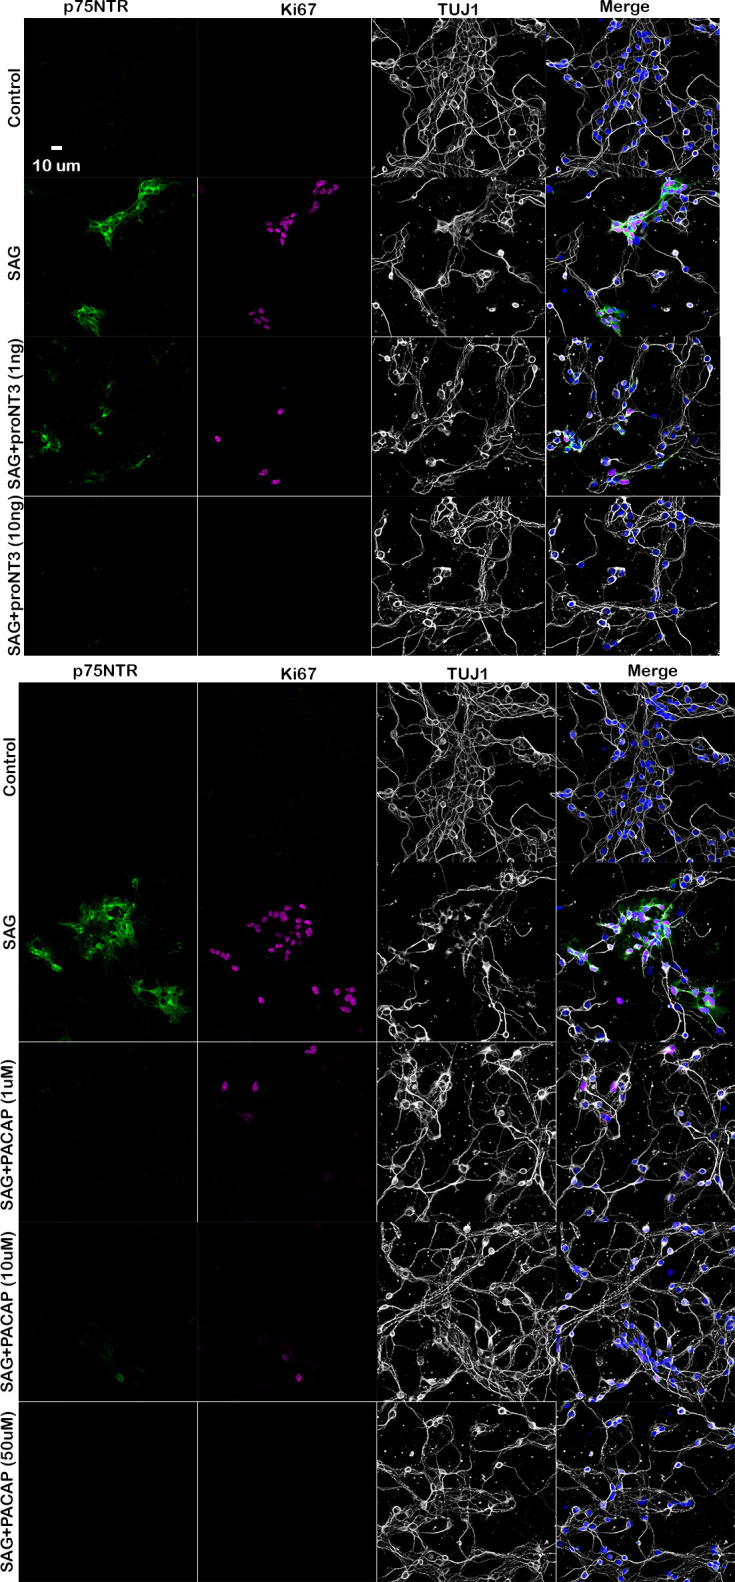
Figure 3—figure supplement 1. Cell cycle exit induced p75 neurotrophin receptor (p75NTR) downregulation.


