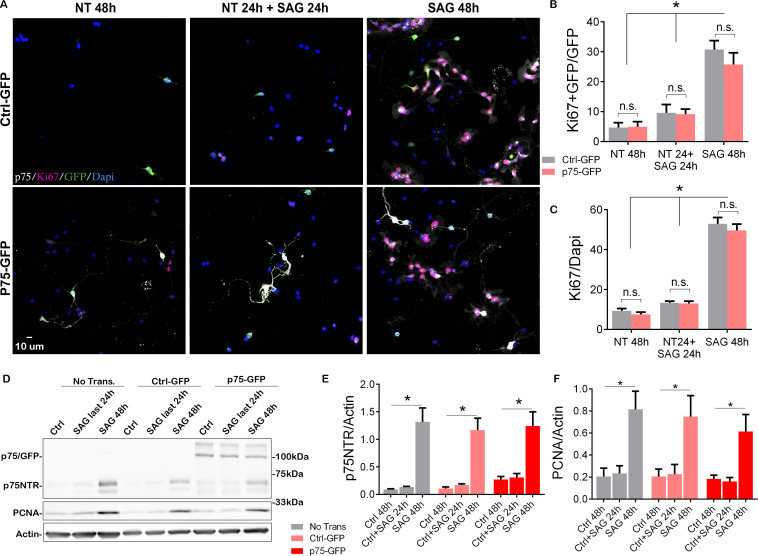
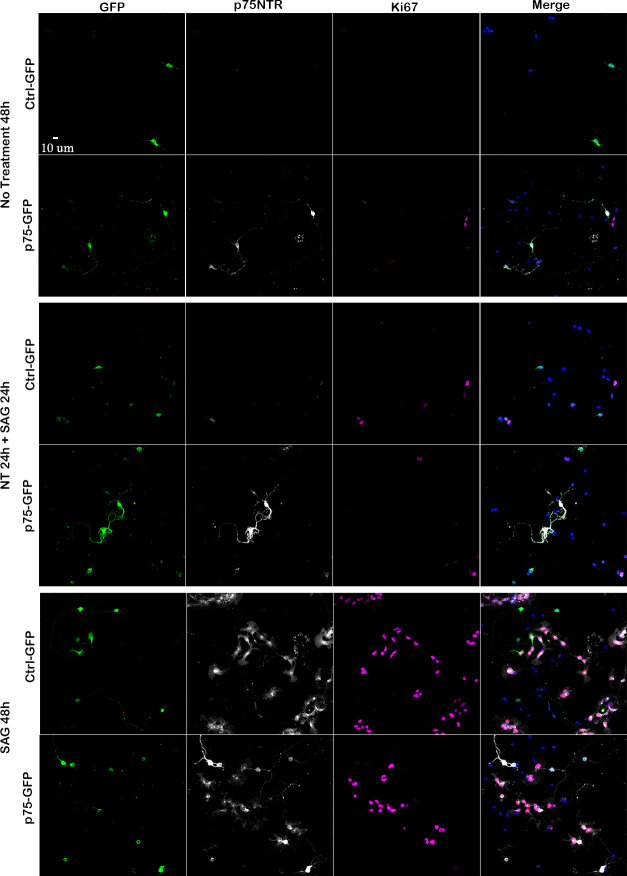
Figure 4. Overexpression of p75 neurotrophin receptor (p75NTR) is not sufficient to maintain granule cells in a proliferative state.
(A) Immunostaining analysis of the expression of p75NTR (white), GFP (green), Ki67 (magenta), and Dapi (blue) in granule cell cultures obtained from P7 rat pups transfected with Ctrl-GFP (top row) or p75-GFP (bottom row) construct. Left panels, cells were maintained in the absence of mitogen for 48 hr. Right panels, transfected cells were maintained in SAG for 48 hr. Middle panel cells were maintained without SAG for the first 24 hr in culture, and in the presence of the mitogen only in the last 24 hr in culture. (B) Quantification of the transfected cells that are proliferating, expressed as the double-labeled Ki67/GFP over the total number of transfected cells (GFP+ cells). Two-way ANOVA, *p=0.0001, N=4, error bars indicate SEM. (C) Quantification of the total number of proliferating cells expressed as the percentage of Ki67+ cells over the total number of cells (Dapi). Two-way ANOVA, N=4, *p=0.0001, error bars indicate SEM. (D) Western blot analysis of the expression levels of p75NTR and PCNA in granule cell cultures obtained from P7 rat pups, first three lanes no transfected cells, last six lanes’ cells transfected with Ctrl-GFP or p75-GFP. (E) Quantification of the expression levels of endogenous p75NTR, Two-way ANOVA, N=4, *p=0.0001, error bars indicate SEM. (F) Quantification of the expression levels of PCNA, Two-way ANOVA, N=4, *p=0.0001, error bars indicate SEM. All the experiments were done using cells obtained from P7 rat pups.


