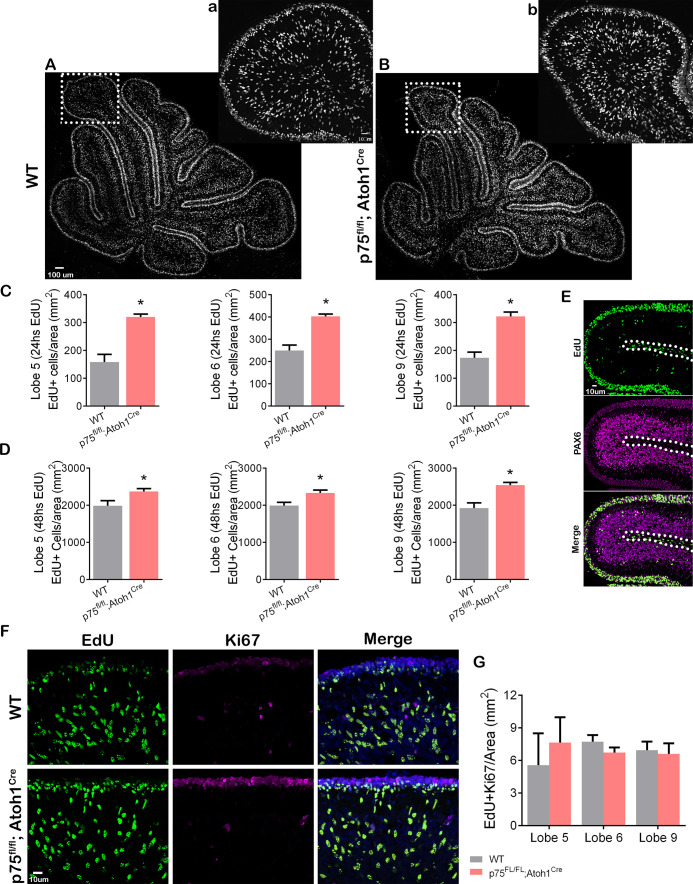
Figure 6. p75 neurotrophin receptor (p75NTR) prevents cerebellar granule neuron (CGN) migration in vivo.
(A–B) Immunohistochemistry for EdU of cerebellar sections from P9 mouse. (a–b) High magnification of the inset shown in panels (A–B). (C–D) Quantification of the density of migrating cells in the cerebellum of mouse pups. Migrating cells are expressed as the total number of EdU positive cells in the internal granule layer (IGL) per mm2. (C) P8 mouse pups injected with EdU 24 hr before euthanizing the animal. Unpaired t-test, WT N=6, p75fl/fl; Atoh1Cre N=4, Lobe 5 *p=0.0001, Lobe 6 *p=0.0001, Lobe 9 *p=0.0001, error bars indicate SEM. (D) P9 mouse pups were injected with EdU 48 hr before euthanizing the animal. Unpaired t-test, WT N=9, p75fl/fl; Atoh1Cre N=9, Lobe 5 *p=0.0302, Lobe 6 *p=0.0117, Lobe 9 *p=0.0012, error bars indicate SEM. (E) Cerebellar section from a WT P8 mouse injected with EdU 24 hr before euthanizing the animal. EdU (green) and Pax6 (granule cell marker, magenta). (F) Immunohistochemistry of cerebellar sections from P9 mouse pups injected with EdU 48 hr before euthanizing the animal. EdU (green), Ki67 (proliferation marker, magenta), and Dapi (blue). (G) Quantification of the migrating cells that continued to express Ki67, expressed as the density of EdU/Ki67 double-labeled cells in the IGL. One-way ANOVA, N=3, p=0.2516, error bars indicate SEM. The experiments presented here were done using P7 to P9 mouse pups.

