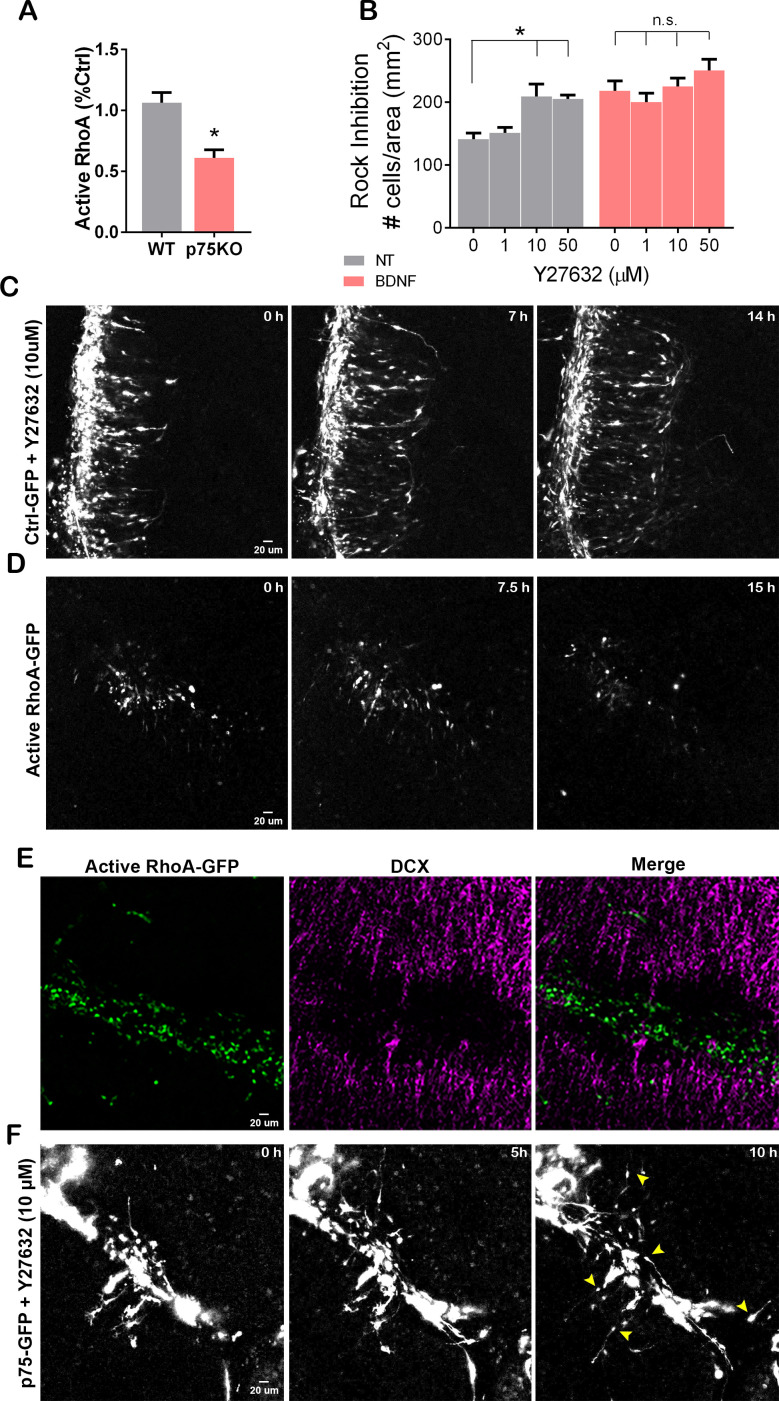
Figure 7. RhoA activation prevents cerebellar granule neuron (CGN) migration.
(A) Quantification of the levels of active RhoA in granule cell cultures from WT or p75KO P7 rat pups after 48 hr in culture. Unpaired t-test, N=4, *p=0.0052, error bars indicate SEM. (B) Migration analysis using transwell assay in cells exposed the Rock inhibitor, Y27632 (top and bottom compartment), and brain-derived neurotrophic factor (BDNF) (bottom compartment). Two-way ANOVA, N=5, *p=0.0005 error bars indicate SEM. (C) Time-lapse pictures from cerebellar organotypic slices from P7 rat pups, transfected with Ctrl-GFP in the presence of the Rock inhibitor, Y27632. (D) Time-lapse pictures from cerebellar organotypic slices from P7 rat pups, transfected with a constitutively active RhoA construct. (E) Immunostaining of the organotypic slice shown in D after clearing the section using the iDisco method, RhoA-GFP (green), and DCX (magenta). (F) Time-lapse pictures from cerebellar organotypic slices from P7 rat pups, transfected with a p75NTR-GFP construct and exposed to Rock inhibitor (Y27632). Arrowheads indicate the migrating neurons where a leading process is observed. The experiments presented here were done using slices obtained from P7 rat pups.

