. 2022 Aug 18;11:e82041. doi: 10.7554/eLife.82041

Figure 1. Crystal structure of the Sso2/Sec3 complex.

(A) Schematics of the constructs of Sso2 (aa1–270) and Sec3 (aa75–260) used in our structural studies. (B) Superposition of the two Sso2/Sec3 complexes in the asymmetric unit of the crystal structure, together with the one reported previously (light gray, pdb code: 5M4Y). (C) Stereo view of the 2FoFc electron density map contoured at 1.8σ level around the binding interface. Maps for Sec3 and Sso2 are colored in cyan and orange, respectively.

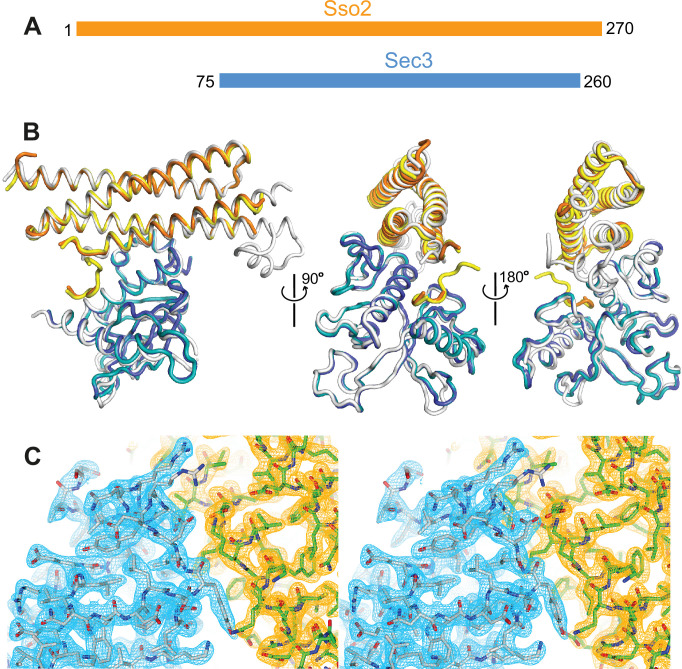
Figure 1.

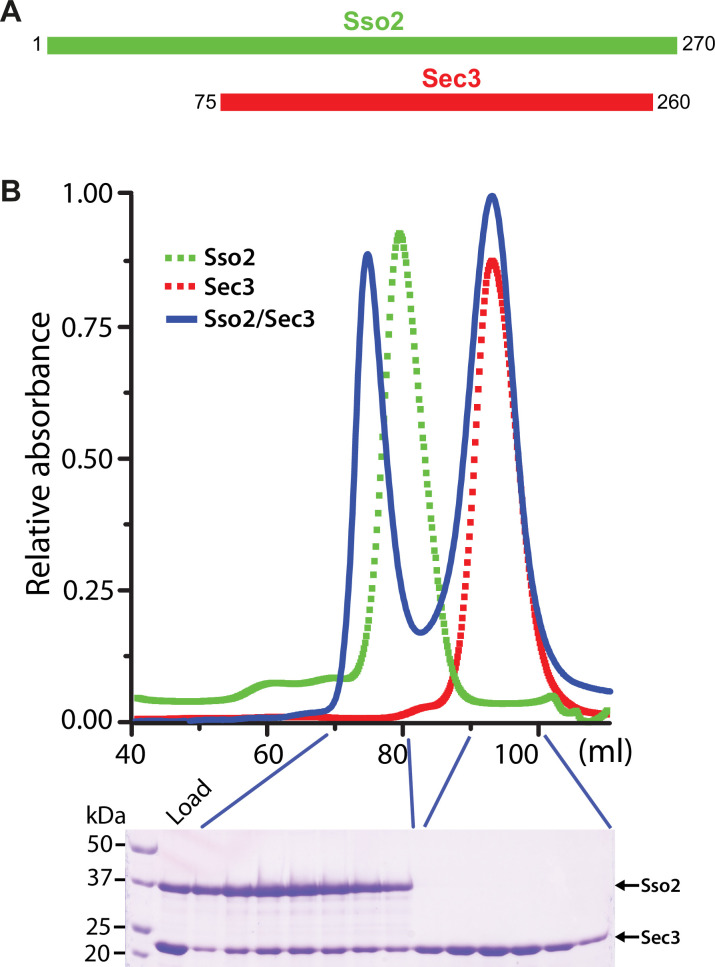
Figure 1—figure supplement 1. Constructs and purification of the Sso2/Sec3 complex.

Figure 1—figure supplement 1.

(A) Schematics of the constructs of Sso2 (aa1–270) and Sec3 (aa75–260) used in our studies. (B) Size-exclusion chromatography elution profiles of Sso2, Sec3, and a mixture of Sso2 and Sec3 (molar ratio 1:3). The SDS PAGE gel shows proteins in the mixture (“Load”) and fractions from the two elution peaks of the mixture. The first peak contains the Sso2/Sec3 complex with both proteins; the second one contains only excessive Sec3 alone.