. 2022 Aug 18;11:e82041. doi: 10.7554/eLife.82041

Figure 2. Structural analyses of the interaction between the NPY motifs of Sso2 and Sec3.

(A) Sequence alignments of Sso2 homologs. Conserved residues are shaded in dark (highly conserved) or light blue (partially conserved). The two NPY motifs are marked as magenta blocks above the aligned sequences, which are connected to helix Ha via a variable linker. (B) Ribbon diagram of the crystal structure of the Sso2/Sec3 complex with first NPY motif (shown as sticks) of Sso2 bound to Sec3. (C) An enlarged view of the NPY motif in (B) together with the 2FoFc map contoured at 1.5σ. (D) Sticks of the NPY motif on top of an electrostatic surface plot of Sec3. (E–G) Crystal structure shows how the second NPY motif of Sso2 interacts with Sec3. (H) Separate views of the binding site show the cork-like NPY motif (magenta) and the complementary cradle-like pocket on Sec3 (light blue). The structure is shown as semitransparent surface together with ribbon diagrams (Sec3) or sticks (Sso2). The broad top part of the ‘cork’ of Sso2 is stabilized by a hydrogen bond between the carboxyl group of the Asn (N) sidechain and the amide proton of Tyr (Y).

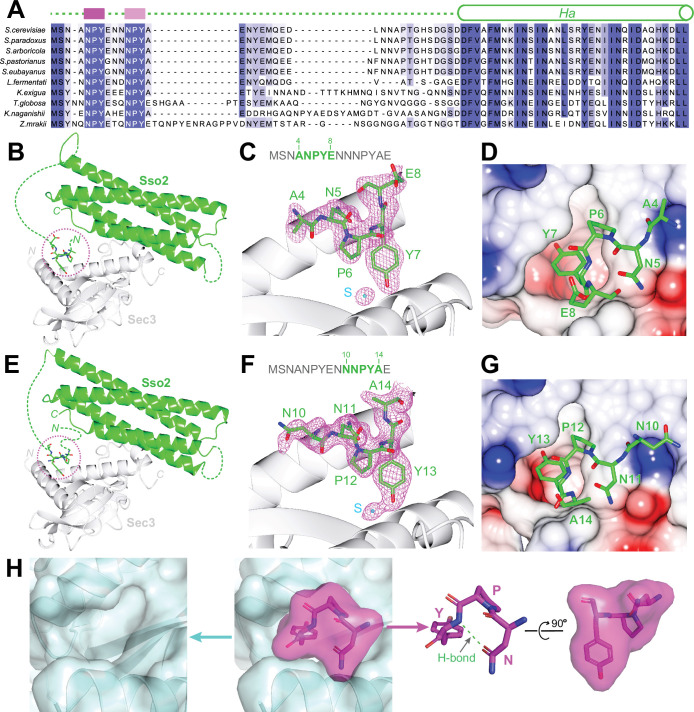
Figure 2.

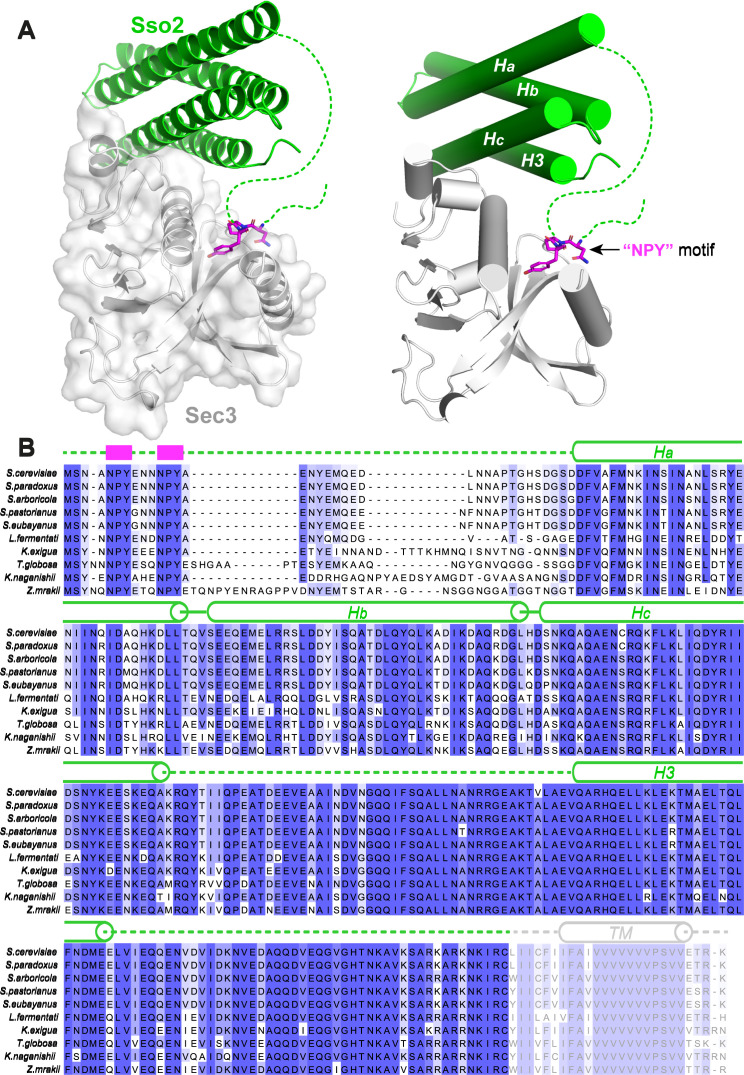
Figure 2—figure supplement 1. Structure of the Sso2/Sec3 complex and conservation analysis.

Figure 2—figure supplement 1.

(A) Two different representations of the Sso2/Sec3 complex structure show the two separate interaction sites between the two proteins. The NPY motif of Sso2 is shown as magenta sticks. Dash lines depict the regions that are invisible in the crystal structure. (B) Sequence alignment of multiple Sso2 homologs. Highly and relatively conserved residues are shaded in dark and light blue, respectively. Secondary structures are shown above the aligned sequences. The two highly conserved NPY motifs at the N terminus of Sso2 are depicted as magenta blocks. Dash lines represent the unstructured loops that are invisible in the crystal structure. The C-terminal twenty-five residues of Sso2, including the hydrophobic transmembrane helix, is colored grey and was excluded from our protein expression construct.
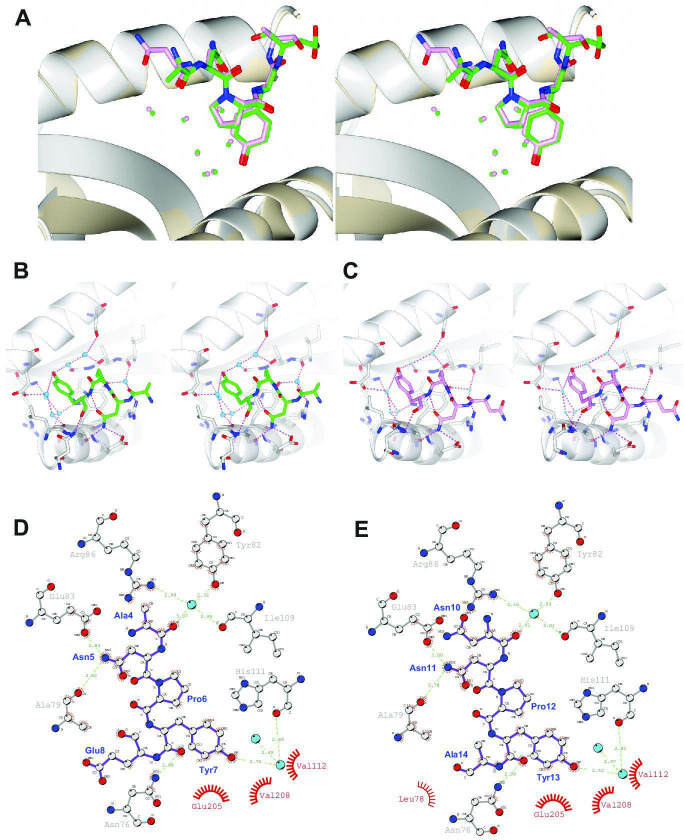
Figure 2—figure supplement 2. Local chemical environment around the NPY motifs in the Sso2/Sec3 complex structure.

Figure 2—figure supplement 2.

(A) Stereo view of the enlarged NPY binding sites of the two superimposed structures. Sec3 and the NPY motifs of Sso2 are shown as ribbons and sticks, respectively. Water molecules bound to the NPY motifs (directly or indirectly) are depicted as spheres with the same colors as the corresponding NPY motifs. (B, C) Separate stereo views of the two NPY binding sites. Sec3 molecules are shown as ribbons, with those residues hydrogen bonded to Sso2 or Sso2-bound water molecules additionally shown as sticks. The NPY motifs and waters are shown as sticks and spheres, respectively. All hydrogen bonds are depicted as dash lines. (D, E) Details of interactions between the NPY motifs of Sso2 (purple) and Sec3 (gray). The plots were generated using DIMPLOT in the LigPlot plus suite. Residues involved in hydrogen bond formation are shown as ball-and-stick, with oxygen, nitrogen, and carbon atoms colored in red, blue, and gray, respectively. Water molecules mediating intermolecular hydrogen bond formation are shown as cyan-colored spheres. Green dash lines indicate hydrogen bonds. Non-bonded residues involved in hydrophobic interactions are shown as spoked arcs. For clarity, only three of the seven bound water molecules are shown.