(
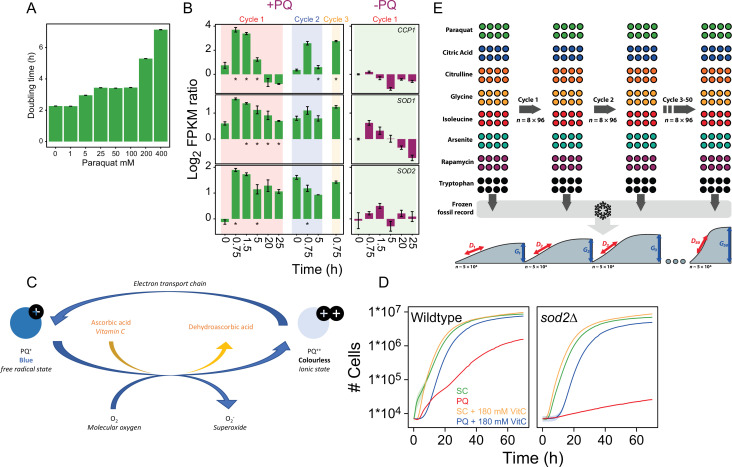
A) Mean doubling time of wildtype yeast cell populations grown with and w/o (0-400 μg/mL) of paraquat. Error bars: S.E.M. (n=122-144). (
B) Left panel: Color columns show the mRNA expression (FPKM; Fragments Per Kilobase Million) of
CCP1,
SOD1, and
SOD2, during the first, second, and third growth cycle in the presence of 400 μg/mL paraquat. Note that the cells have not yet been exposed to paraquat at time,
t=0 in Cycle 1. Right panel: mRNA expression in the founder population in a paraquat-free growth medium. x-axis: time (h) in each growth cycle.
y-axis: Expression values are shown as a log
2 ratio in relation to expression in a paraquat-free medium at
t=0. Error bars: S.E.M (n=3). * = significant (Wald test, FDR q=0.05) difference. (
C) Schematic representation of how vitamin C counters paraquat toxicity. Outside cells, paraquat remain in the colorless ionic Pq
2+ state. Upon cellular and mitochondrial uptake, Pq
2+ accepts electrons from OXPHOS complex III and assumes the damaging Pq
+ free radical form, which turn cells slightly blue. Pq
+ donates an electron to O
2, forming O
2∙− while resuming the Pq
2+ state. When present, vitamin C, accepts electrons from Pq
+, preventing it from generating O
-2. This shifts paraquat back to the colourless Pq
2+ state. Vitamin C may also accept electrons from the O
2∙− that is formed, further reducing the intracellular pool of O
2∙−. (
D) Growth (mean) of wildtype (left panel; n=96) and
sod2Δ (right panel; n=96) yeast cell populations in the absence and presence of 400 μg/mL of paraquat and/or 180mM of the antioxidant ascorbic acid. Shade=S.E.M. (
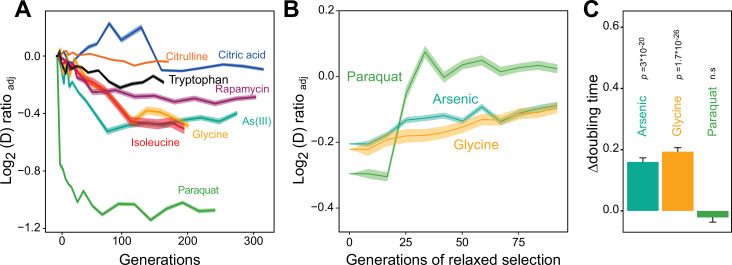
E) Design of adaptation experiment. We adapted 96 initially homogeneous, asexually reproducing, haploid yeast populations to paraquat ( stress) and seven non-mitochondrial challenges (
Supplementary file 1) over 50 growth cycles (
t1-t50). Populations were maintained as an array of 96 colonies on solid agar medium in which the stressor had been imbedded. Each growth cycle corresponded to 72 h of growth from lag to stationary phase, in which ~5x10
4 cells were subsampled to seed the next growth cycle. We stored subsamples from the end of batch cycles 0-5, 7, 9, 12, 15, 20, 25, 30, 35, 40, 45, and 50 of all 96 populations as a frozen record. We revived and reanalyzed these (n=6) in a randomized design to accurately capture the adaptation kinetics for 768 populations. We counted cells in each population at 20 min intervals and extracted cell doubling times, (
D), from the mid-exponential phase and estimated cell generations, (
G), as the number of population doublings from the start to end of each batch cycle. We extracted cell doubling times, (
D), and log
2 normalized these to those of many founder controls,
Dnorm. We subtracted the
Dnorm before stress exposure,
Dnorm,0, to estimate the doubling time adaptation achieved, which is annotated as Log
2
(D) ratioadj.


