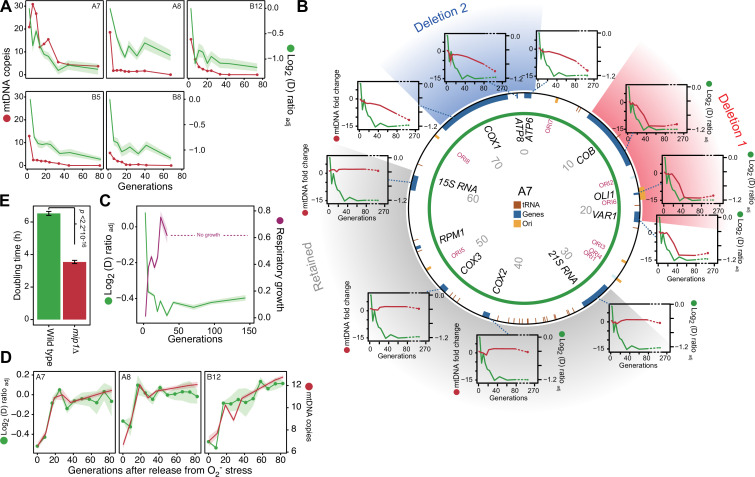
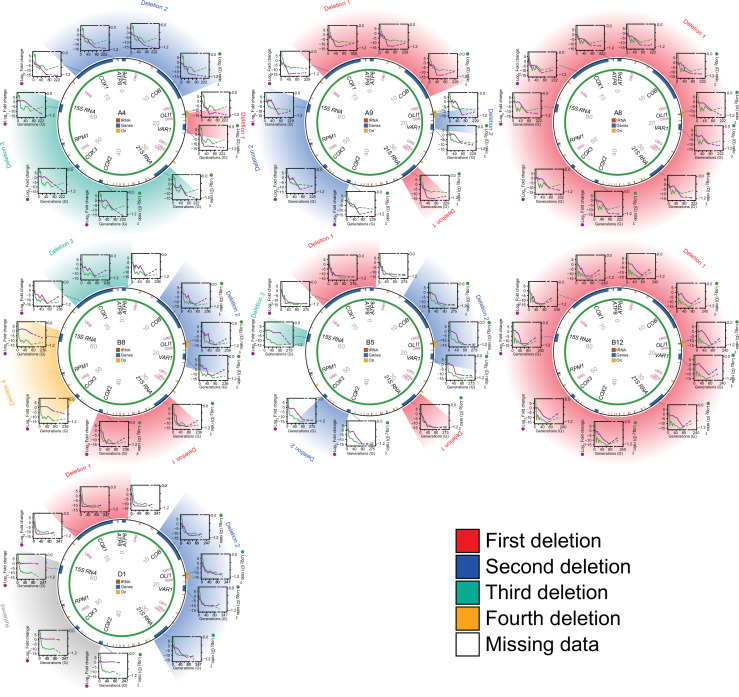
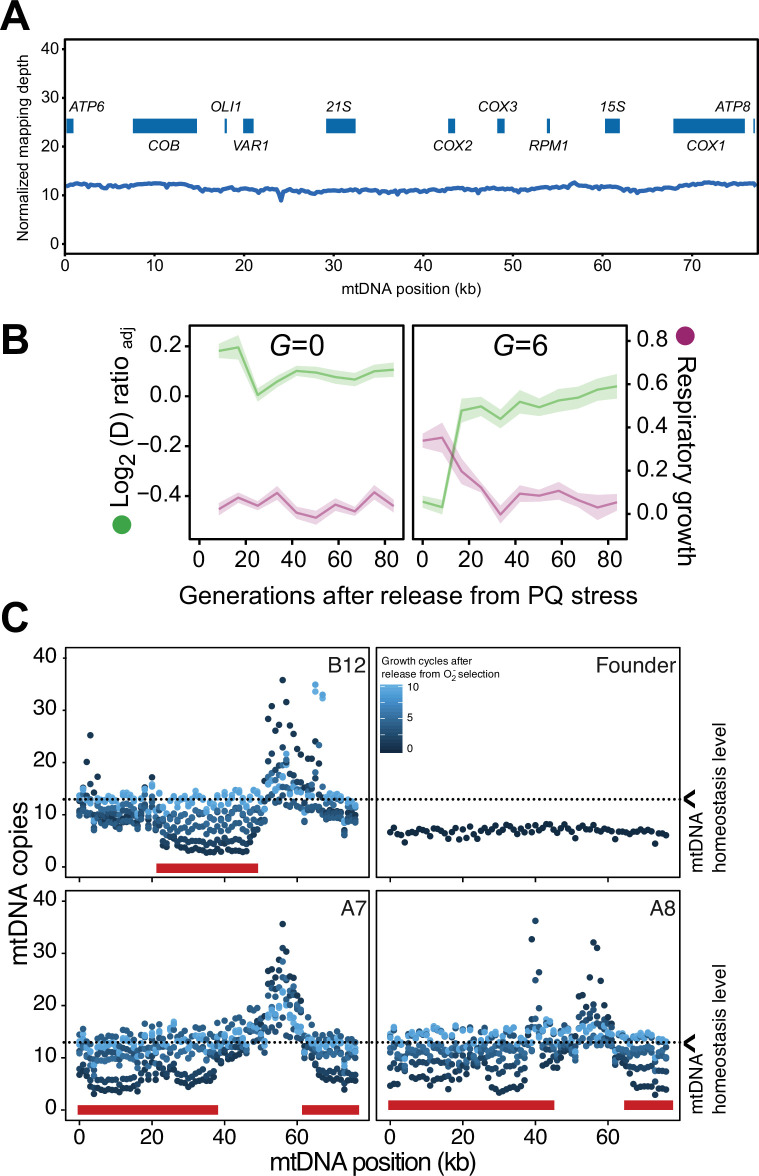
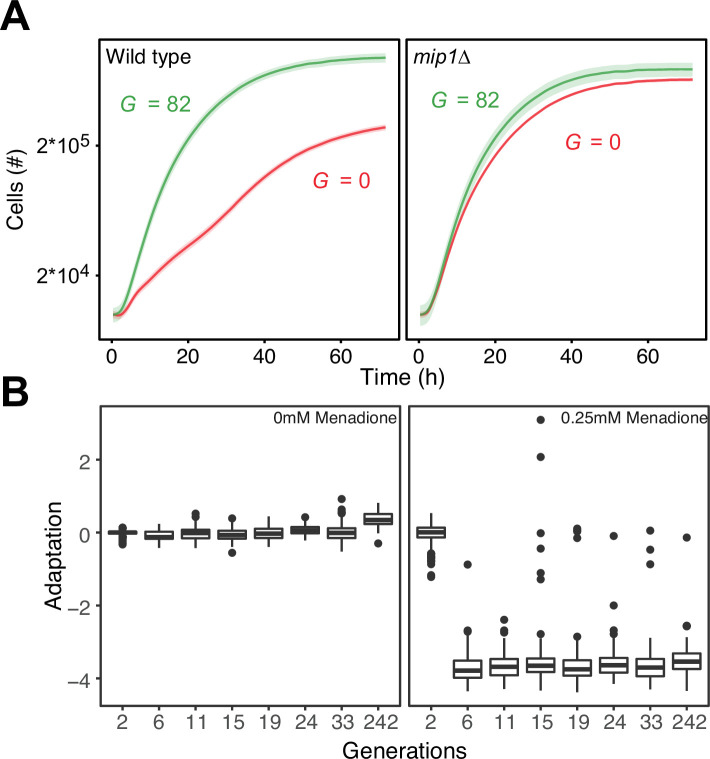
Figure 3. mtDNA editing causes the early adaptation to paraquat.
(A) mtDNA copy number change (left y-axis, red line, median coverage relative to the haploid nuclear genome) during paraquat adaptation (right y-axis, green line, n=6) for 5 populations (panels). Shade: S.E.M. (B) mtDNA deletions associate with the paraquat adaptation. Circle: mtDNA (77 kb) before exposure to paraquat. Genes, origins of replication and position (kb) are indicated. Coloured fields: mtDNA deletions with concerted copy number change. Diagrams: mtDNA copy number change (left y-axis, purple line) of individual mtDNA genes during adaptation (right y-axis, green line) in population A7. Shade: S.E.M. (n=3). (C) The early-phase paraquat adaptation coincides with the loss of respiratory (glycerol) growth. Shade: S.E.M. 96 populations, each measured at n=5. Broken line indicates no growth (cell doubling time >24 h). (D) Recovery of the copy number of deleted mtDNA (right y-axis, red line) after release from 6 generations of paraquat exposure coincides with loss of the early-phase paraquat adaptation (left y-axis, green line, shade = S.E.M (n=15)) in populations A7, A8, and B12. (E) Doubling time (h) of wild type and mip1Δ cell populations in paraquat. Error bars: S.E.M. (n=191). p-values: Welch two-sided t-test. See also Figure 3—figure supplements 1–3.


