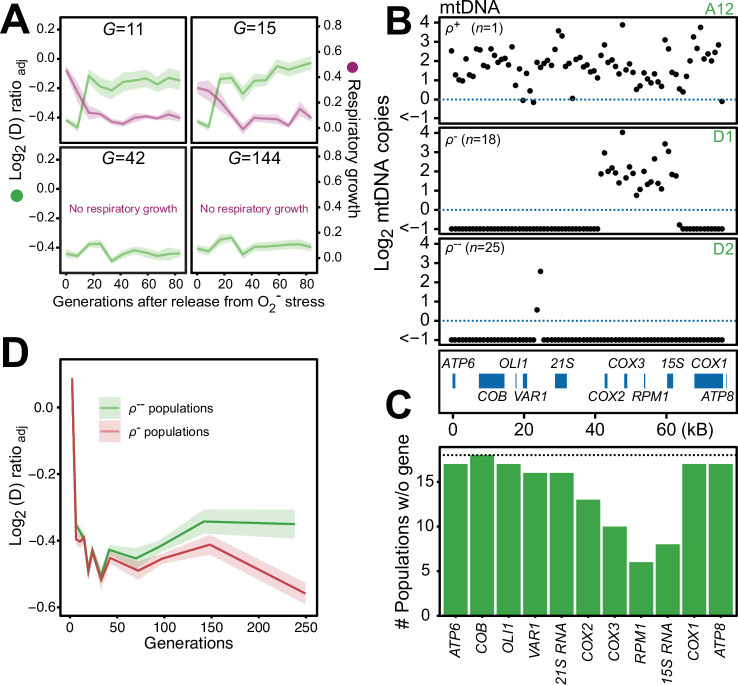
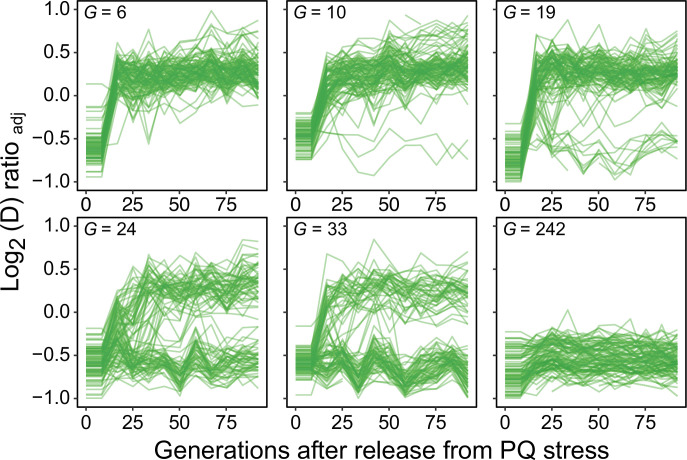
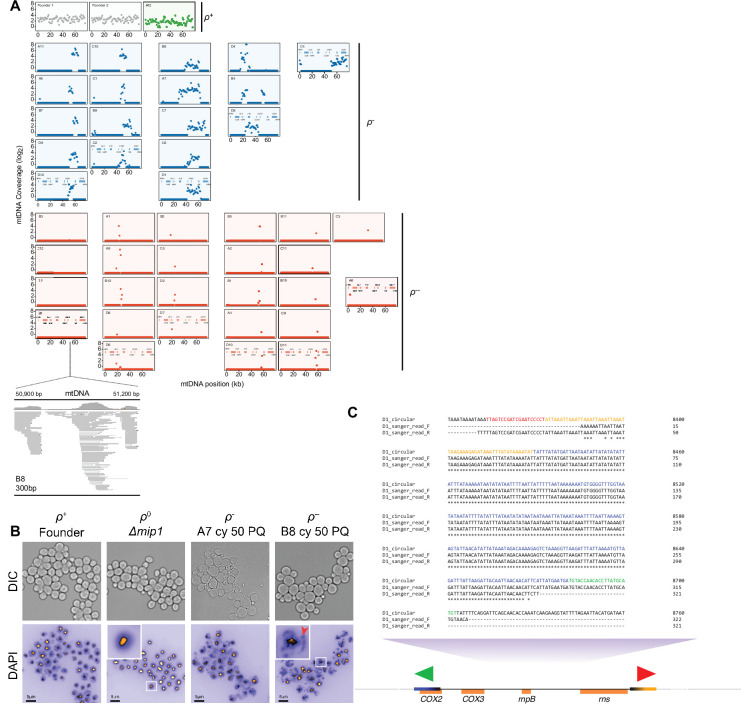
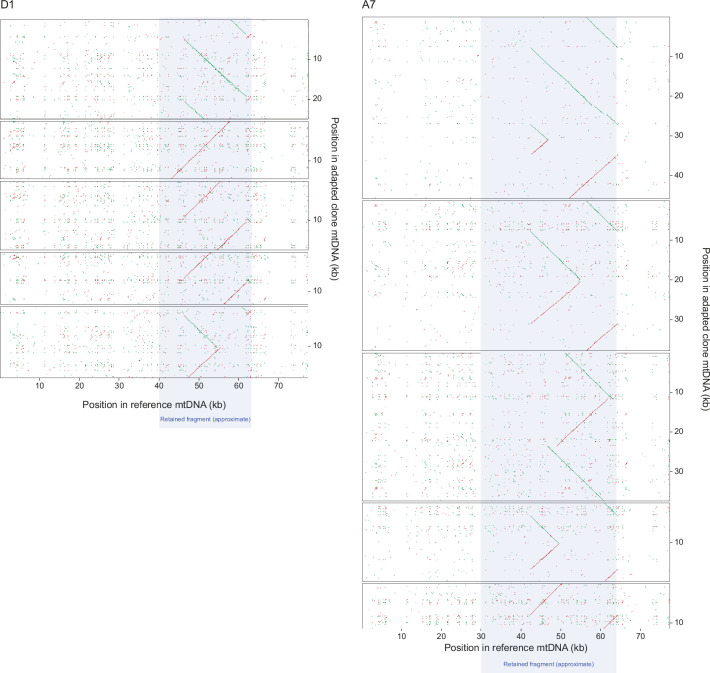
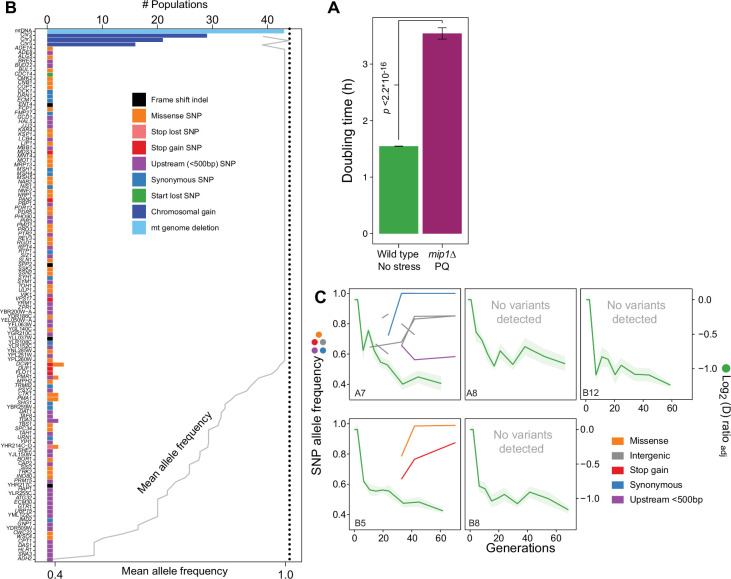
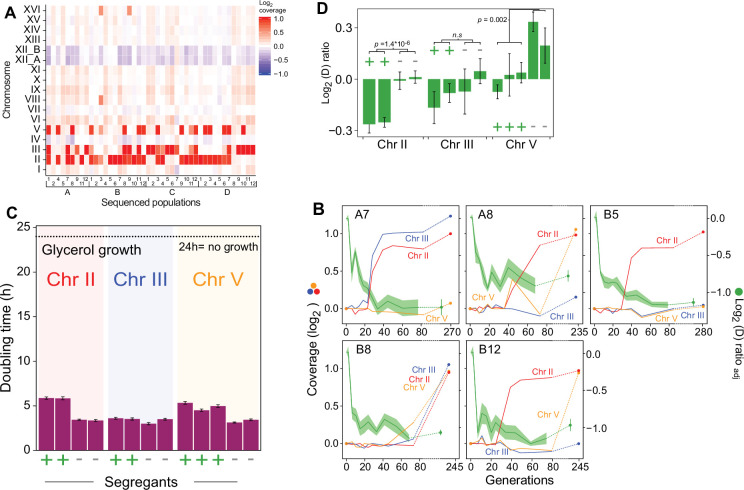
Figure 6. Chronic exposure to paraquat causes irreversible mitochondrial impairment by sustained mtDNA editing.
(A) Paraquat adapting cell populations (G=generations of exposure to paraquat) ultimately lose their capacity to recover respiratory (glycerol) growth (right y-axis, purple line, log2 doubling time relative to founder) and the loss coincides with the genetic fixation of the paraquat adaptation (left y-axis, green line). Shade: S.E.M. of 5 populations, each measured at n=5. (B) All but one (ρ+) sequenced cell population adapted to long-term paraquat stress (t50) retain only small (6–30 kb; ρ-) or very small (<2 kb, ρ--) mtDNA segments. Panels: Representative populations. y-axis: mtDNA copy number (median coverage in 1 kb windows relative to haploid nuclear genome). Gene positions are indicated. (C) Number of ρ- populations after long-term paraquat exposure (t50) in which the specified mtDNA gene was lost. (D) The ρ-- populations became less fit than the ρ- populations during a long-term exposure to paraquat. See also Figure 6—figure supplements 1–5.

