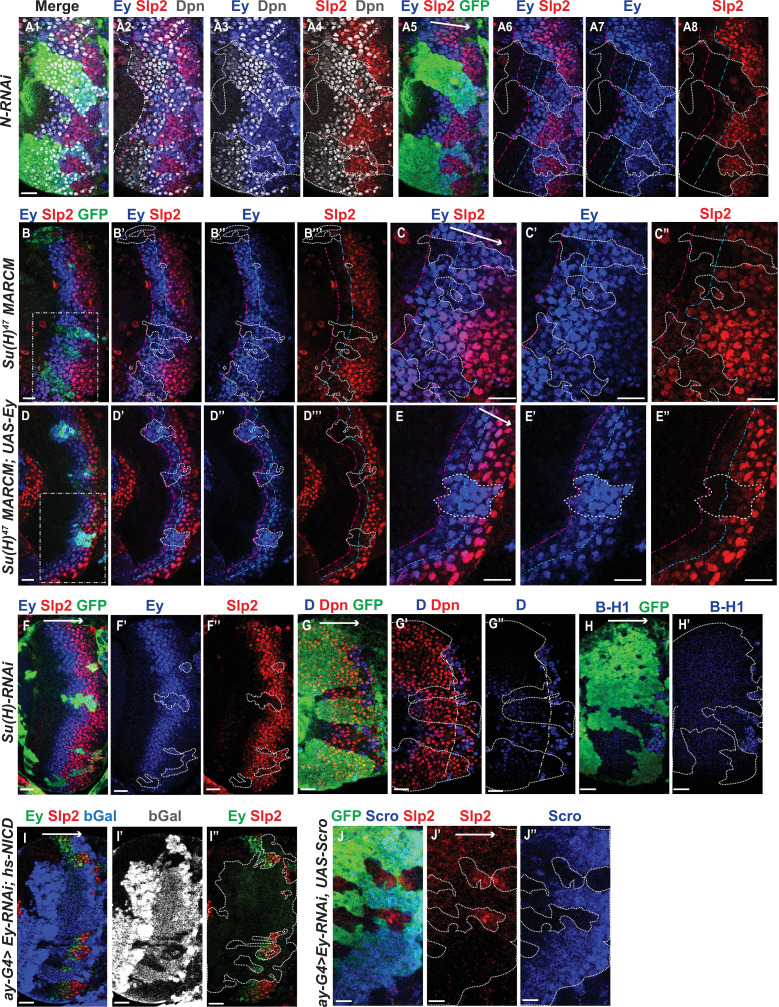
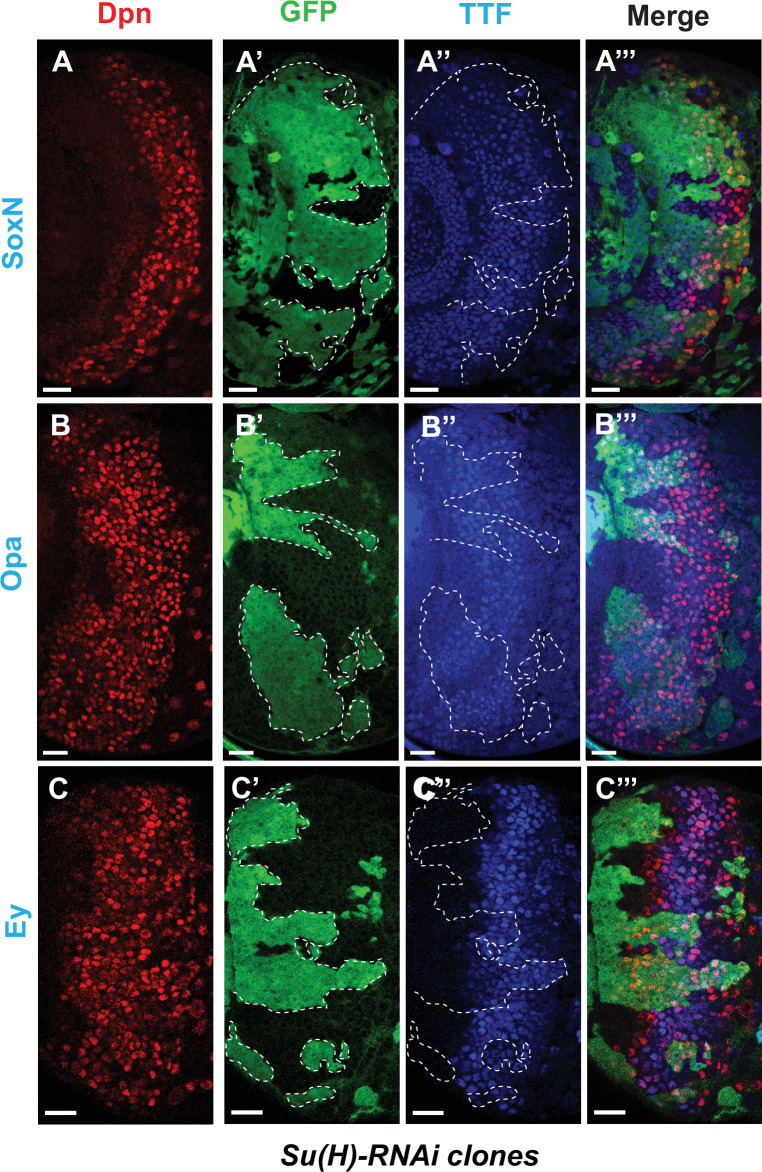
Figure 5. Genetic interactions between Notch, Ey and Scro in the regulation of Slp expression.
In all panels, dotted lines outline clone margins. Dash-dotted lines mark the expected transition front for Dpn or TTFs (white for Dpn, pink for Ey, cyan for Slp2, and yellow for D). The curvature of the dash-dotted lines is determined by the curvature of Dpn or the previous TTF. (A1–A8) In N-RNAi clones marked by GFP in green, Ey is turned on in the 5th-8th NB (6.50±1.05, n=6), and the transition to Slp stage occurs in the 6th –9th Ey +NB (7.67±1.21, n=6). In control regions (not marked by GFP), Ey is turned on in the 2nd –3rd NB (2.50±0.55, n=6), and the transition to Slp stage occurs on the 3rd –4th Ey +NB (3.83±0.41, n=6). The delay of Ey expression and the further delay of Slp transition are significant by t-test (p=4.8 × 10⁻⁵ and p=0.0003, respectively). (B-B’’’) In Su(H) mutant clones marked by GFP, Ey expression is delayed and the transition to Slp stage is further delayed: Slp2 is still barely detectable or very weak at the 6th –8th Ey +NBs (6.80±0.84, n=5). In control regions, the transition to Slp2 stage occurs in the 4th Ey +NBs (n=5). The further delay of Ey to Slp transition is significant by t-test (p=0.002). (C-C’’) Magnified view of the rectangle area containing three clones shown in B. (D-D’’’) In Su(H) mutant clones over-expressing Ey, the transition to Slp2 stage is still delayed to the 6th-7th Ey +NBs (6.40±0.55, n=5). In control regions, the transition occurs in the 3rd-4th Ey +NBs (3.80±0.45, n=5), The further delay of Ey to Slp transition is significant by t-test (p=4.50 × 10⁻⁵). (E-E”) Magnified view of the rectangle area containing one clone shown in D. (F-H’) The expression of Ey and Slp2 (F-F’’), Dichaete and Dpn (G-G’’), and BarH-1 (H,H’) in Su(H)-RNAi clones marked by GFP. (I-I’’) Supplying active NICD using hsFlp; dpn >FRT-STOP-FRT-NICD (heat shocked for 12 min 3 days before dissection) is not sufficient to activate Slp2 expression in Ey-RNAi clones marked by bGal. (J-J’’) Supplying Scro is not sufficient to activate Slp2 expression in Ey-RNAi clones marked by GFP. Scale bars 20 µm.


