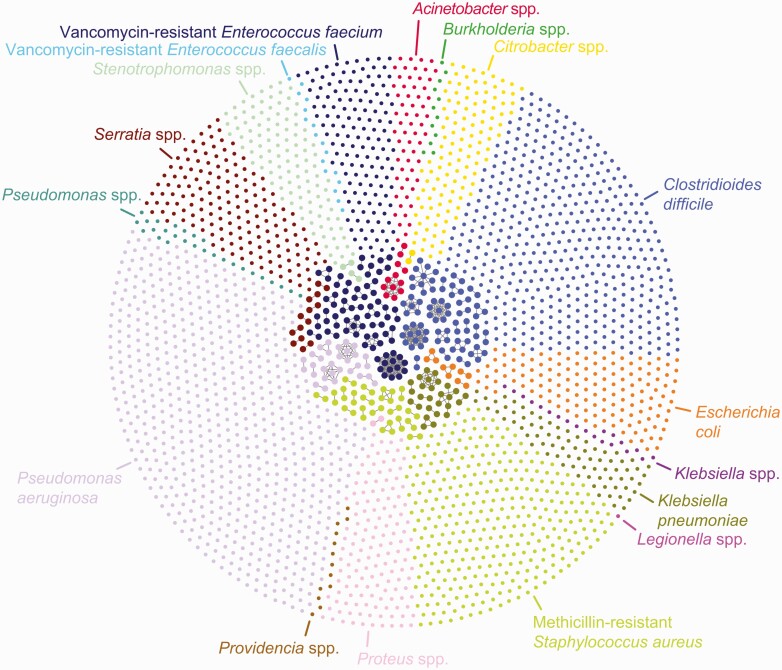
Figure 2.
Cluster network of EDS-HAT isolates sequenced, grouped by bacterial species. The outer circle shows patient isolates that are not genetically related. The inner circle shows outbreaks of genetically related isolates as defined by cgSNP cutoffs described in Methods. The network plot was visualized with Gephi. Abbreviations: cgSNP, core genome single nucleotide polymorphism; EDS-HAT, Enhanced Detection System for Healthcare-Associated Transmission.

