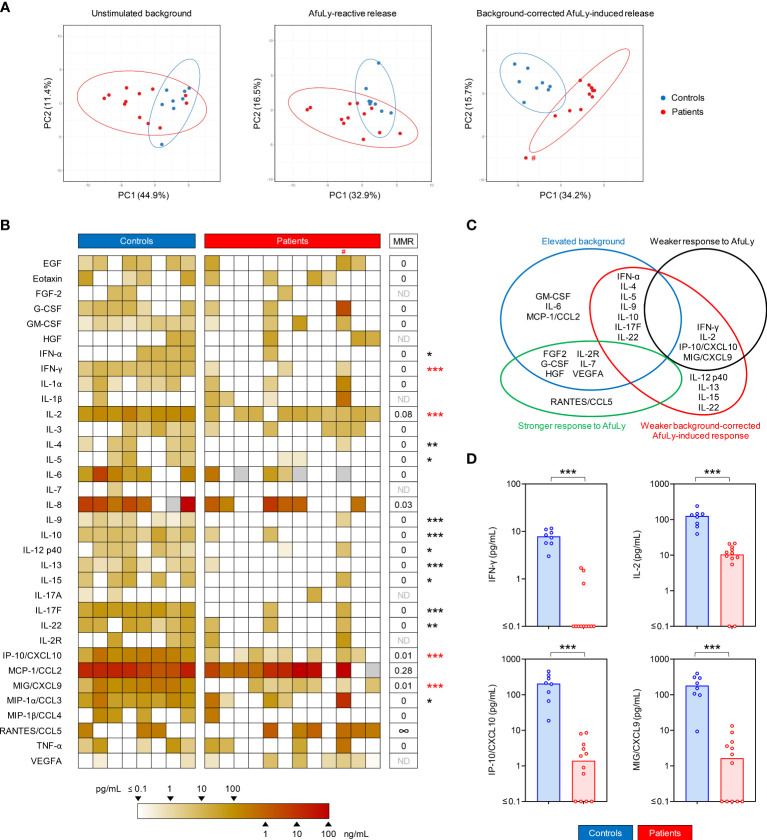
Figure 3.
Whole blood from COVID-19 patients elicits weakened Aspergillus fumigatus-induced cytokine responses. (A) Principal component analysis (PCA) comparing unstimulated background secretion, Aspergillus lysate (AfuLy)-reactive, and background-adjusted AfuLy-induced cytokine release. Ellipses represent 95% confidence ranges. (B) Heat map representing individual background-adjusted AfuLy-induced cytokine responses. IL-1RA is not shown (0 pg/mL in all subjects). Grey boxes indicate non-determinable values (i.e., measurements with unstimulated background exceeding the detectable range). # denotes the outlier in the PCA. MMR = median-to-median ratio (patients/controls). ∞ = infinite MMR (median 0 pg/mL in the control cohort). ND = MMR not defined (median 0 pg/mL in both cohorts). Mann-Whitney U test (patients versus controls) and Benjamini-Hochberg procedure to test for a false-positive discovery rate (FDR) of < 0.2. *p < 0.05, **p < 0.01, ***p < 0.001. (C) Venn diagram summarizing statistically significant alterations in unstimulated background, AfuLy-reactive, and background-adjusted AfuLy-induced cytokine responses in COVID-19 patients versus controls. Significance was defined as p < 0.05 and FDR < 0.2. (D) Individual and median (columns) background-adjusted AfuLy-induced concentrations of cytokines that showed both, significantly weaker AfuLy-reactive and background-adjusted AfuLy-induced release in COVID-19 patients, indicated by red asterisks in panel (B). ***p < 0.001.

