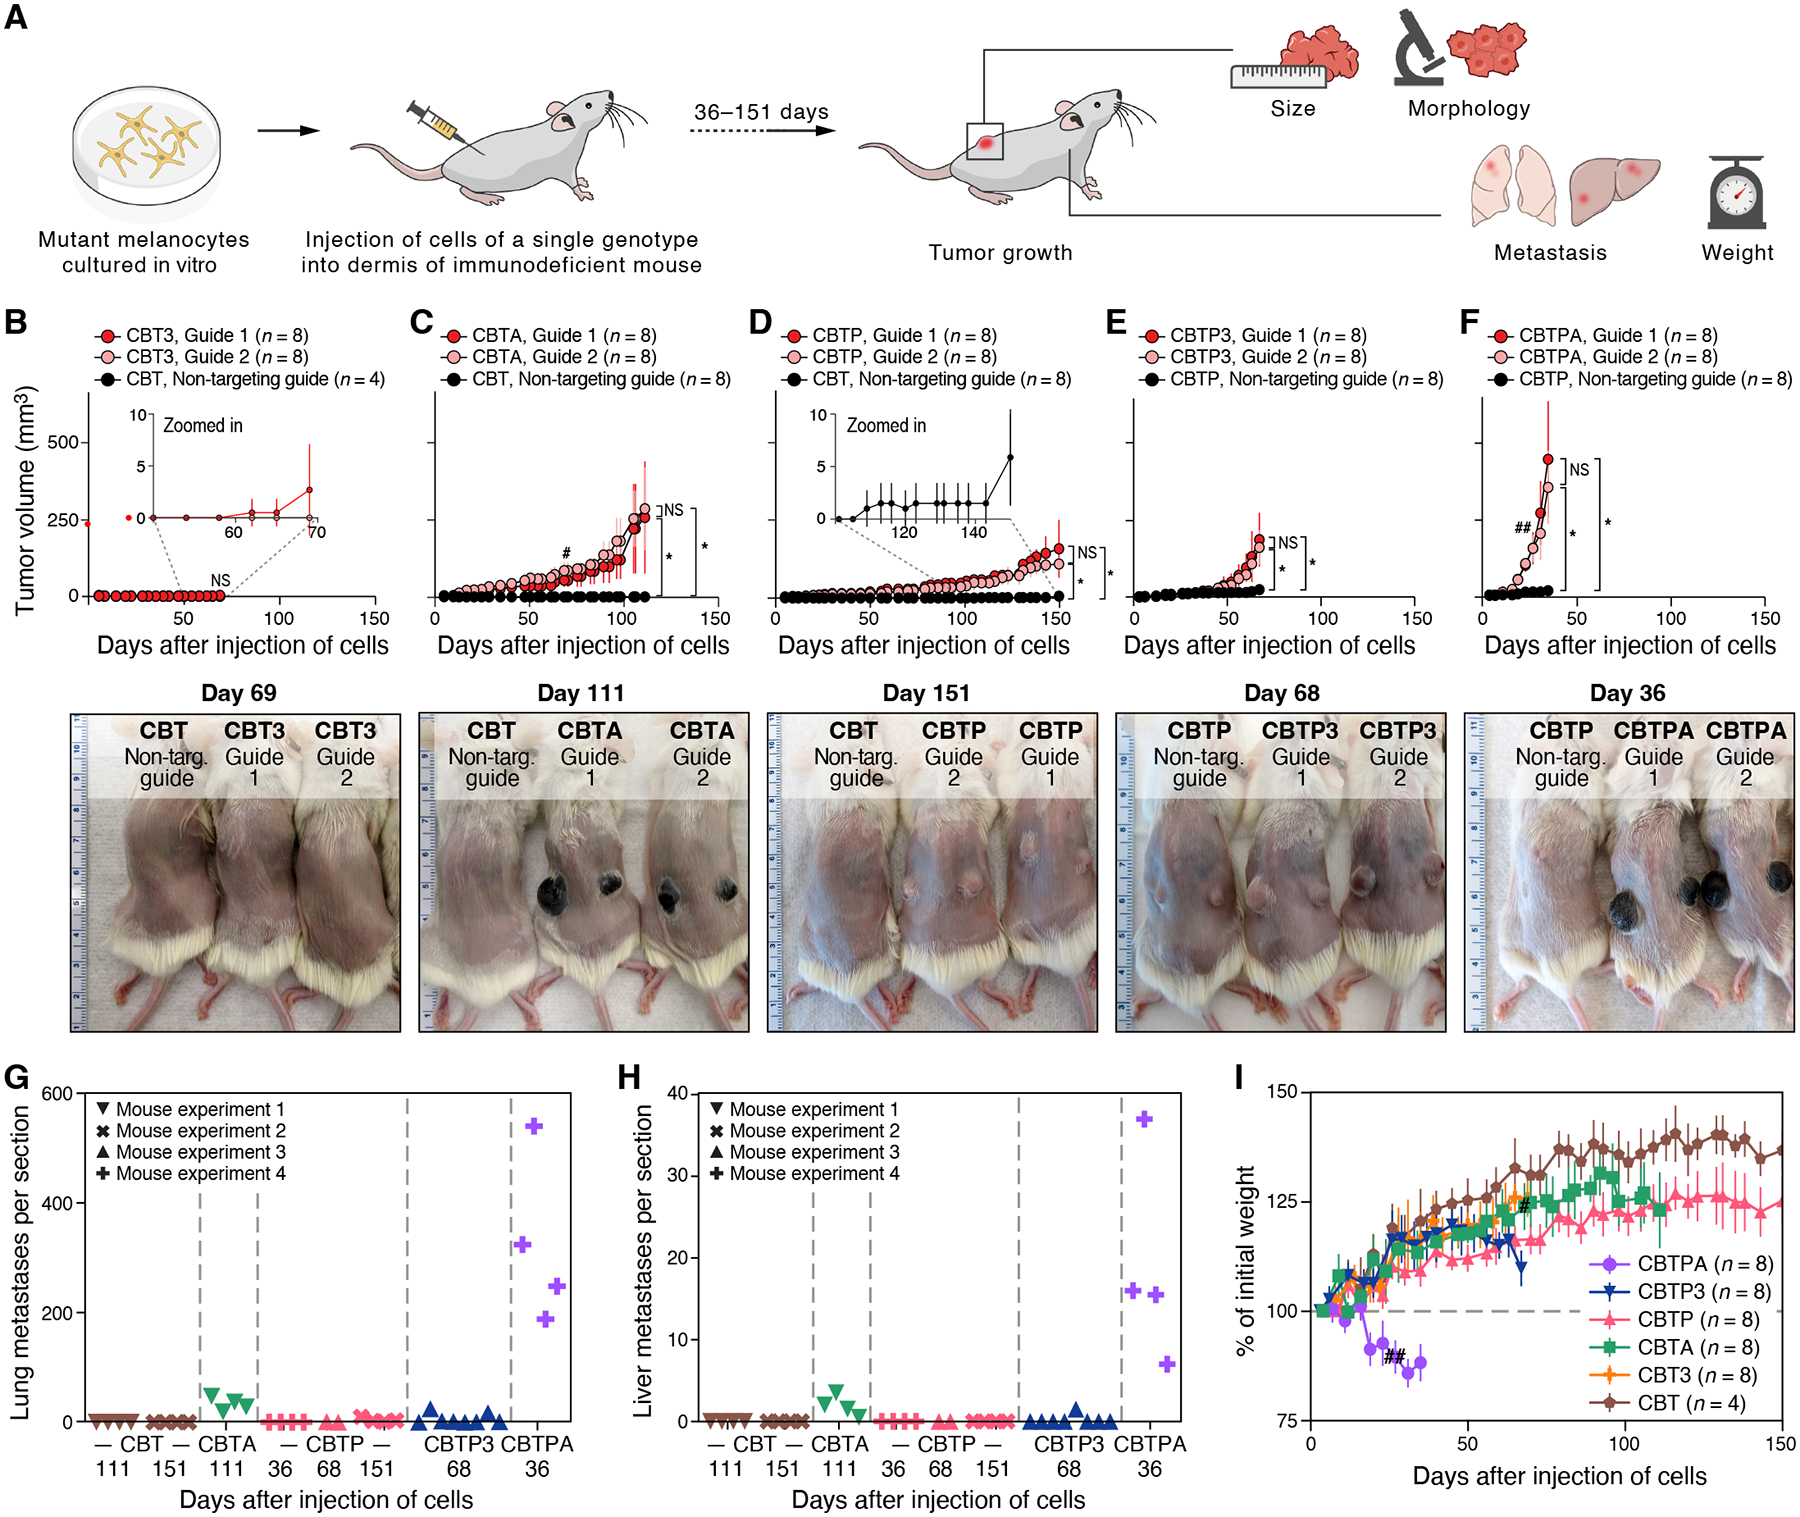
Figure 3. Mutation combinations confer diverse, disease-relevant phenotypes in vivo.

(A) Experimental approach to identify disease-relevant phenotypes caused by engineered mutations in vivo. (B-F) Primary tumor growth of xenografted mutant melanocytes in NSG mice compared to CBT or CBTP control parental cells, as shown, that received non-targeting Cas9 RNP: (B) CBT3, (C) CBTA, (D) CBTP, (E) CBTP3, and (F) CBTPA cells. Top panels: tumor size (mm3, y axis) over time (days, x axis) following two intradermal injections, one in each flank. n: number of tumors. Bottom panels: representative images of (shaved) mice harboring mutant cells as marked. Ruler with large, numbered marks in centimeters for scale. (G, H) Loss of APC promotes frequent distant metastases. Average number of individual metastatic foci per section (symbols) of lung (G) or liver (H) tissue in a histologic slide (y axis, counted manually) obtained from a single mouse injected with a mutant cell line (genotype indicated by color) and collected after the indicated number of days (x axis). Each slide had an average of three lung sections and two liver sections, each from a different lobe. (I) Injected CBTPA melanocytes cause rapid weight loss in mice. Percent of initial mouse weight (y axis, determined after subtracting primary tumor weights (estimated at 1g/cm3) from measured mouse weights) over time (x axis, days). n: number of mice. Data in (G, H) are from the four independent experiments in (C-F). # two CBTA mice, one from each guide group, were sacrificed for histological inspection. ## one CBTPA mouse was euthanized due to primary tumor ulceration. * p < 0.01, NS not significant, two-tailed, two-sample Student’s t-test.
