
Figure 5. Tumor genotype shapes tumor microenvironment composition.
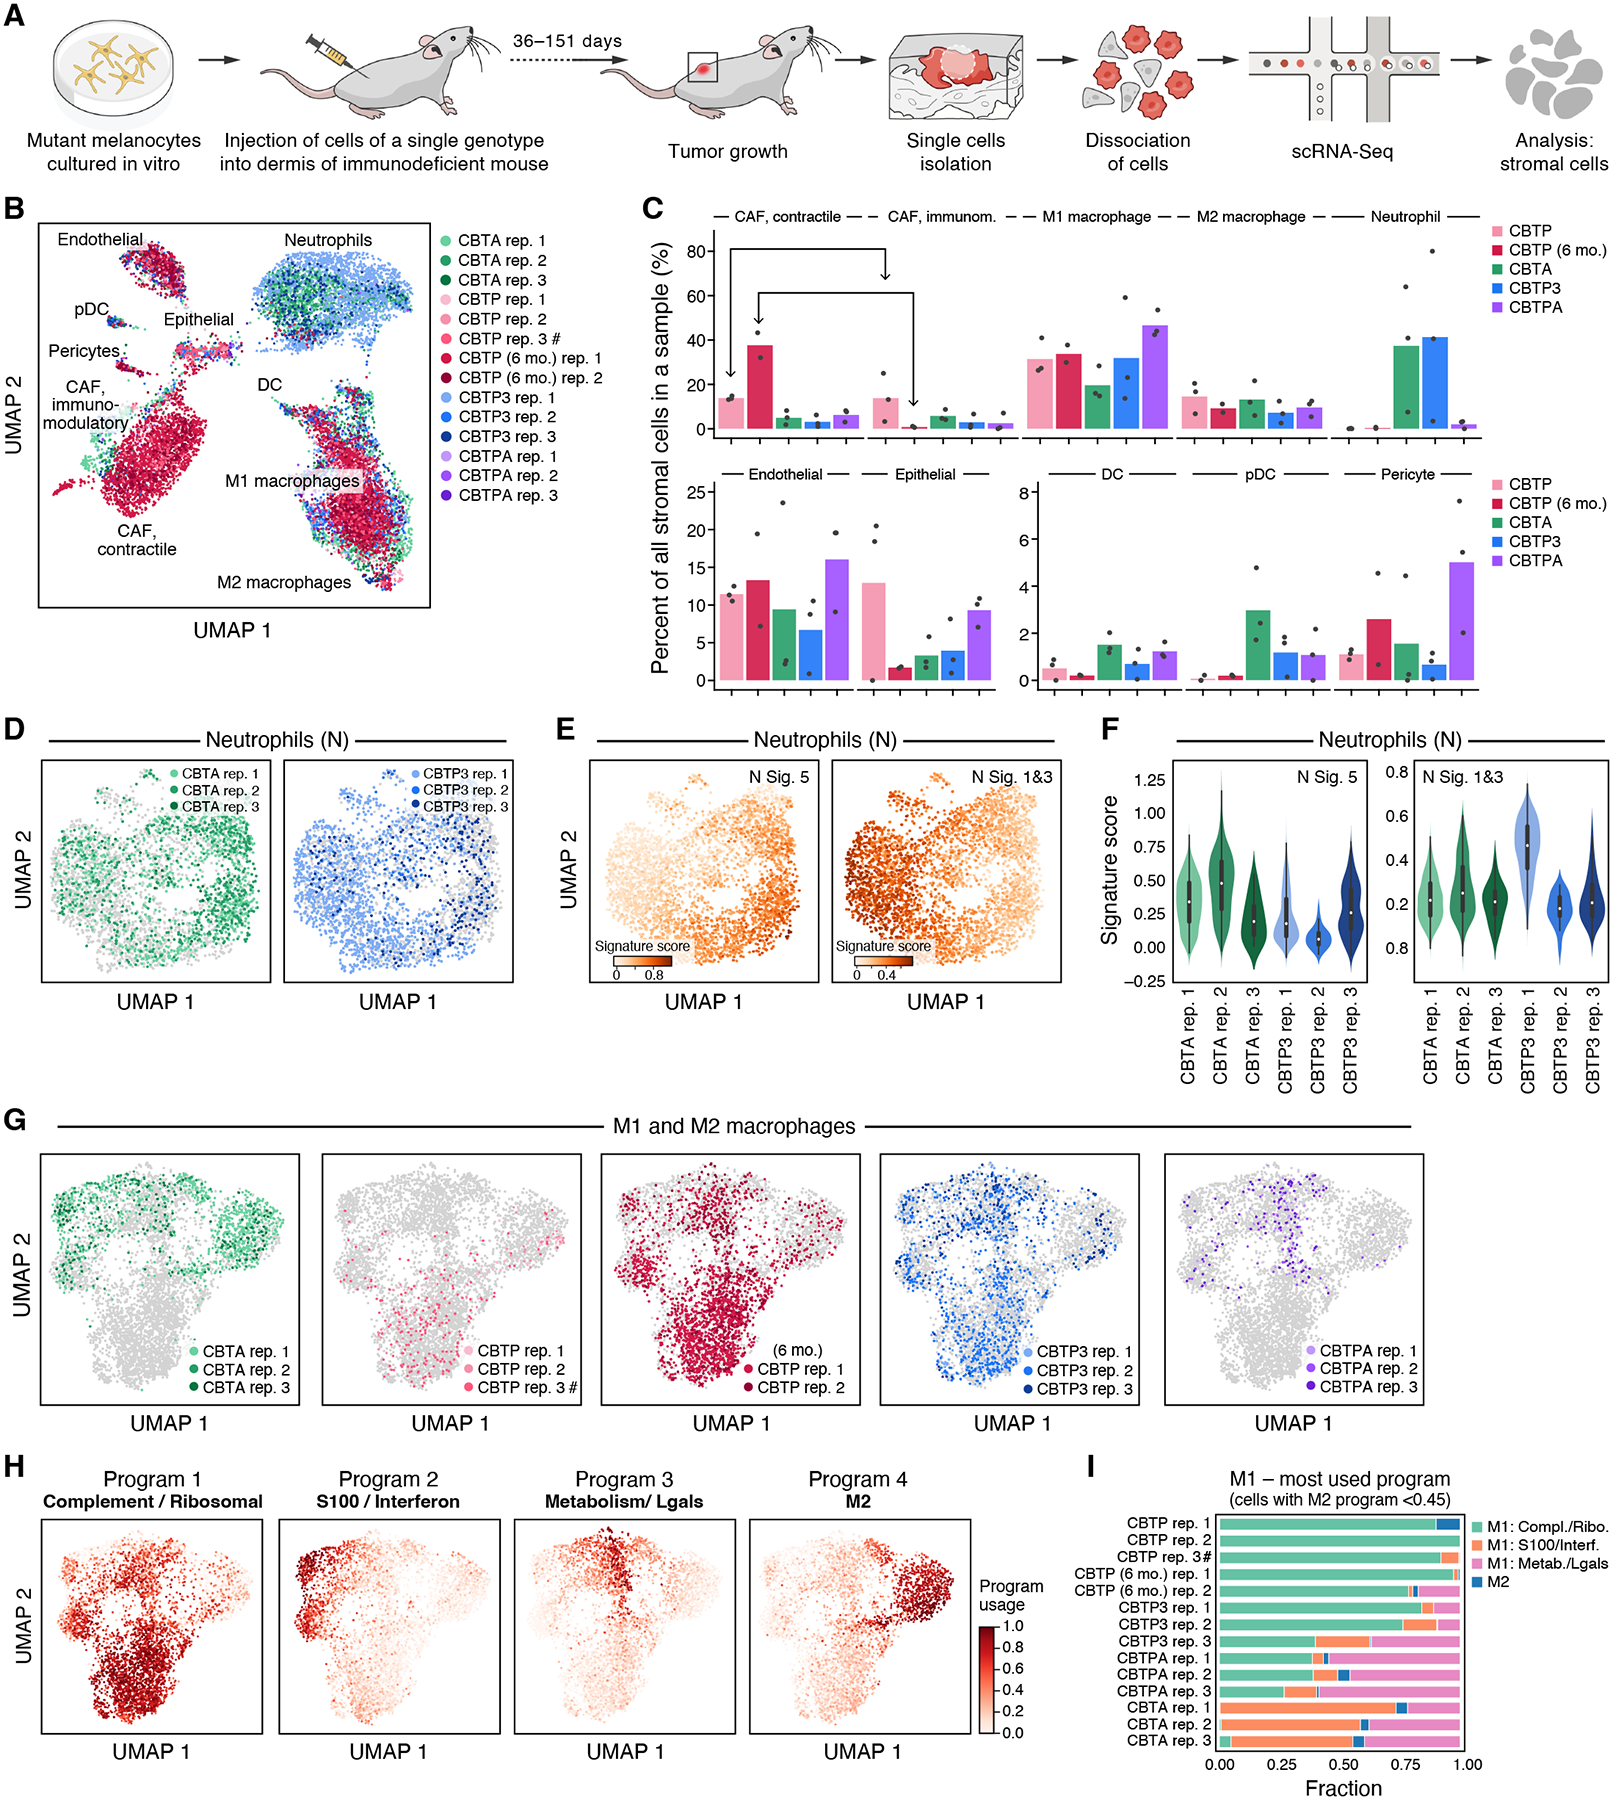
(A) Experimental approach to profile gene expression from mouse cells in tumor xenografts with scRNA-seq. (B,C) Remodeling of the tumor microenvironment cellular composition by cancer cell genotype and duration in mouse. (B) UMAP embedding of tumor microenvironment scRNA-seq profiles (dots) colored by genotype and replicate (legend), and labeled by cell type. #: CBTP rep. 3 is a mixture of four tumors from two mice, whereas all other replicates are from a single tumor. (C) Mean (bar) and individual (dots) percent (y axis) of tumor microenvironment cells of each type (x axis) in each genotype (color). (D-F) Diversity of neutrophil expression programs in tumors of different genotypes. (D) UMAP embedding of neutrophil single cell profiles (dots) from specific tumor genotypes (color) and all other genotypes (gray). (E) UMAP embedding of neutrophil profiles (as in D) highlighting only the neutrophils in CBTA and CBPT3 tumors colored by per-cell score of neutrophil expression signatures, N5 (associated with tumor growth) and N1N3 (more similar to circulating and healthy-tissue neutrophils); signatures previously described (55). (F) Distribution of per-cell neutrophil expression program score (y axis) in neutrophils from CBTA (green) and CBTP3 (blue) tumors. p-value < 0.001 (N5), p-value < 0.001 (N1N3), Kruskal-Wallis rank sum test, df = 5. (G-I) Impact of tumor genotype on macrophages expression programs. (G,H) UMAP embedding of M1 and M2 macrophage single-cell profiles (dots), colored by specific tumor genotypes (G), or by per-cell relative usage of macrophage gene expression cNMF programs (H). (I) Fraction of cells (x axis) with the highest score in each of four cNMF programs (colors) among M1 cells (defined as cells with M2-related program score <0.45) in each replicate (y axis).