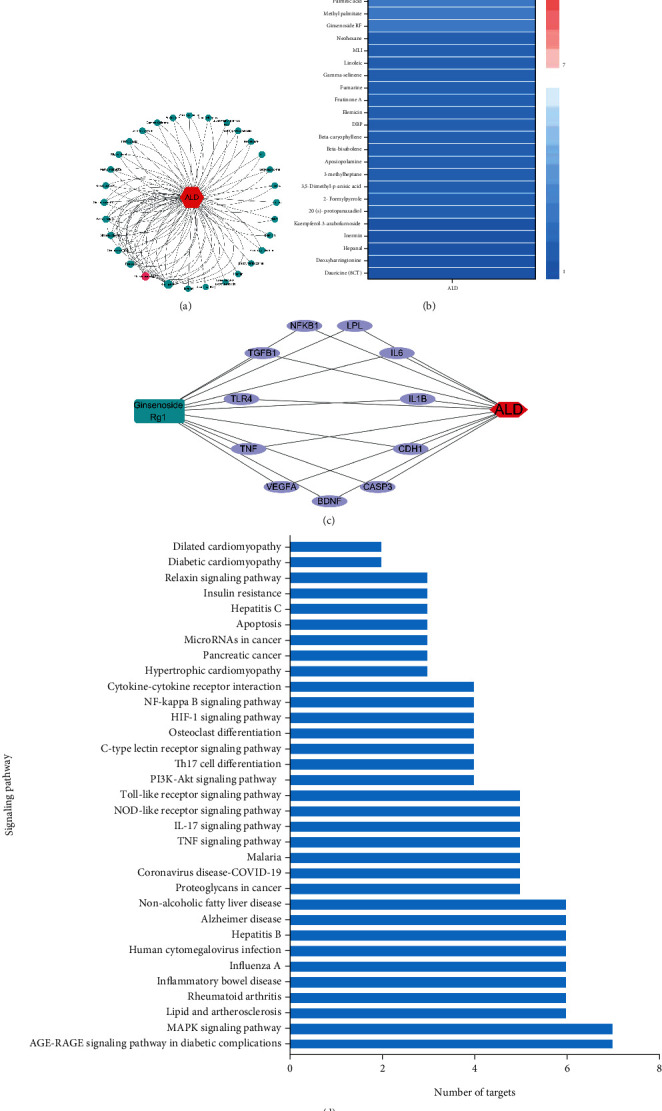
Figure 3.

Potential targets analysis of bioactive components in ginseng against ALD. (a) Rank diagram of the degree between bioactive ingredients and ALD. The size of circle reflects the degree. (b) Heat map of the degree between bioactive ingredients and ALD. Blue and red colors indicate low and high degree value, respectively. (c) GRg1 targets ALD network. Purple ellipse nodes represent potential targets of GRg1 against ALD. (d) Enrichment diagram of KEGG pathway.
