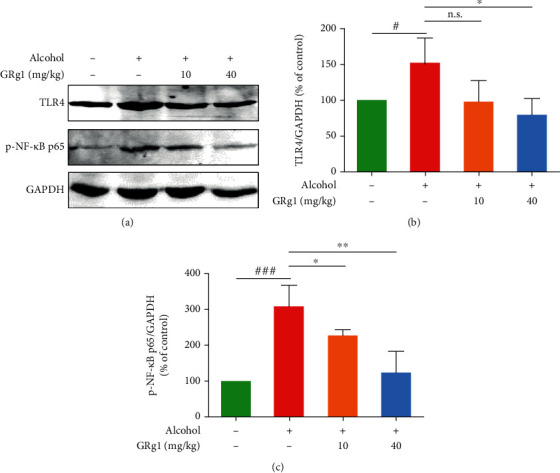
Figure 6.

The TLR4/NF-κB pathway in the liver. (a) The protein levels of TLR4 and p-NF-κB p65 were detected using western blotting. Densitometric analysis of (b) TLR4 and (c) p-NF-κB p65. #P < 0.05 and ###P < 0.001 vs. control group. ∗P < 0.05 and ∗∗P < 0.01 vs. alcohol group. n.s. indicates no significant difference.
