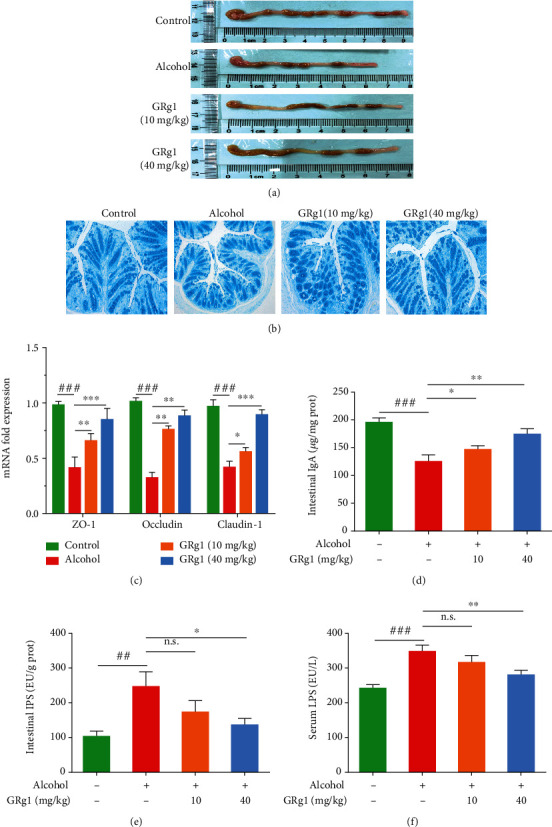
Figure 7.

Intestinal barrier function in the colon. (a) The length of the colon. (b) The colon tissues were stained by Alcian blue (200×). (c) The mRNA expression levels of tight junction proteins (ZO-1, occludin, and claudin-1). (d) IgA levels, (e) intestinal LPS levels, and (f) circulating LPS levels. ##P < 0.01 and ###P < 0.001 vs. control group. ∗P < 0.05, ∗∗P < 0.01, and ∗∗∗P < 0.001 vs. alcohol group. n.s. indicates no significant difference.
