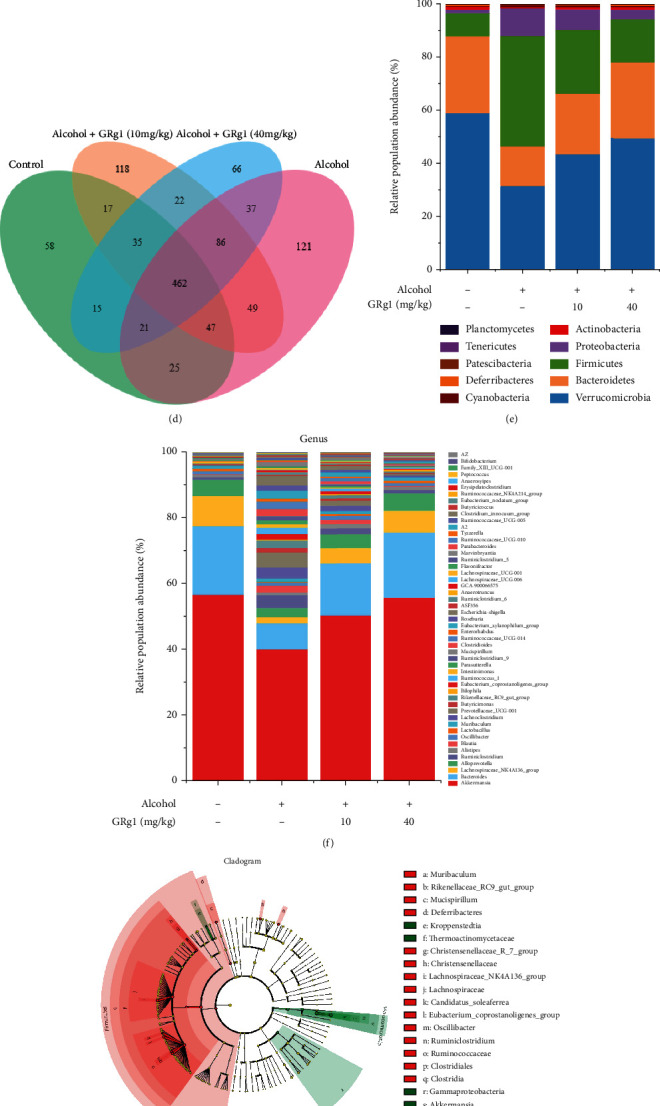
Figure 8.

Intestinal microbiota composition in cecum. (a) Chao1 richness index. (b) Shannon diversity index. (c) PCA plot. (d) Venn diagram. (e) Relative abundances of microbial composition at phylum levels. (f) Relative abundances of microbial composition at genus levels. (g) LEfSe taxonomic cladogram between alcohol group and high-dose GRg1 group. The size of the circles is based on relative abundance. (h) LDA score diagram. ###P < 0.001 vs. control group. ∗∗P < 0.01 and ∗∗∗P < 0.001 vs. alcohol group.
