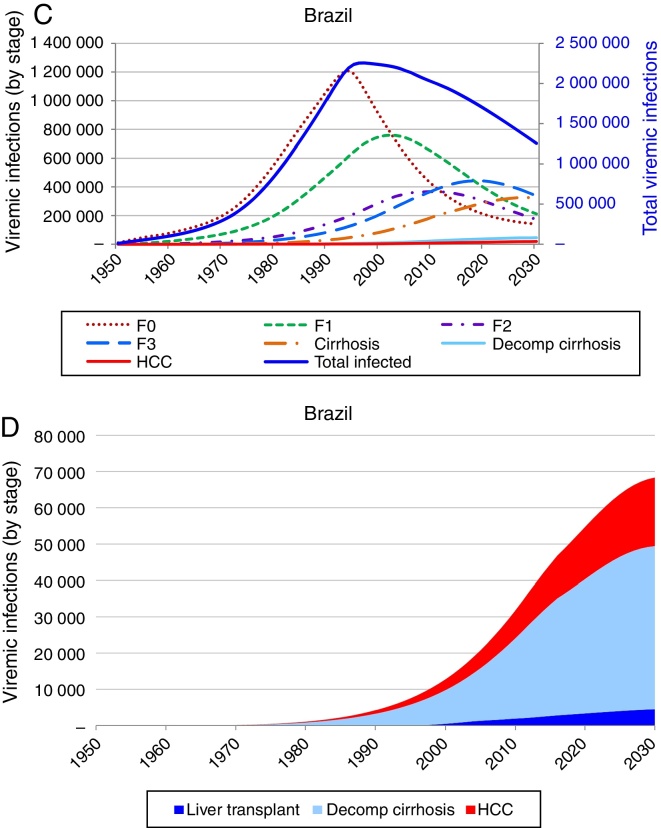
Fig. 2.
Base case model outputs. (A) Total viremic cases, by age, 2013; (B) Annual mortality due to liver related and background cause, 2013–2030; (C) Number of viremic cases, in total, and by disease stage, 1950–2030; (D) Expanded graph of viremic cases by disease stage for cirrhosis, decompensated cirrhosis, and hepatocellular carcinoma, 1950–2030.


