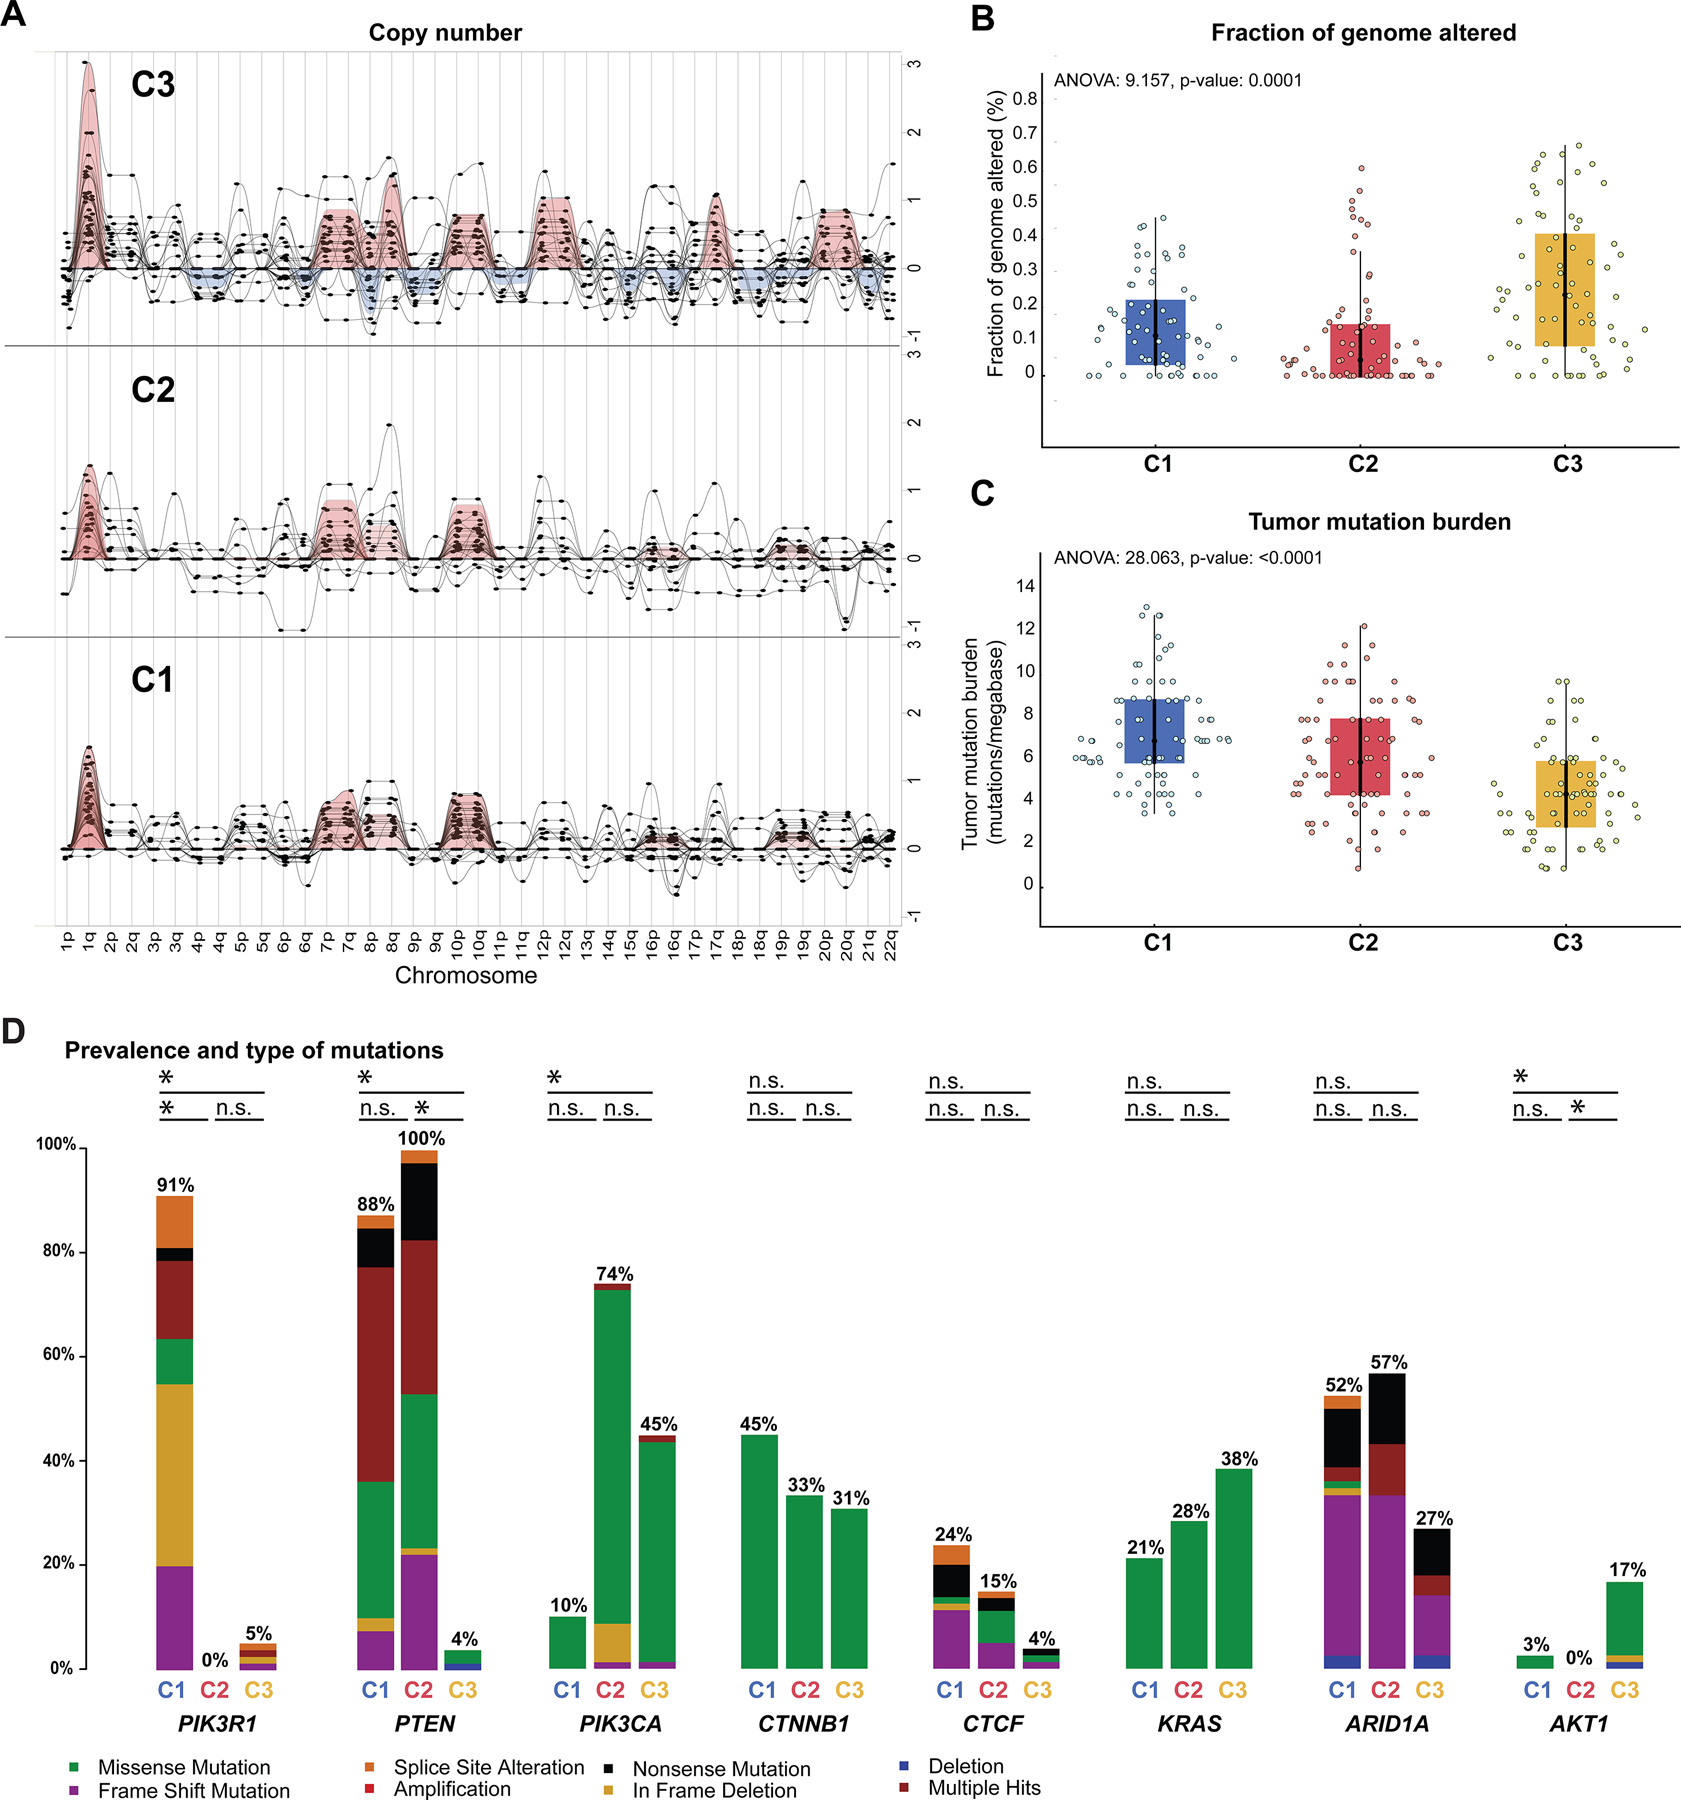
Figure 3. Global genomic landscape of NSMP uterine endometrioid carcinomas.

(A) Summary of broad copy number alterations in the three molecular clusters of uterine endometrioid carcinomas of no special molecular profile (NSMP-UEC) based on GISTIC results. Each column indicates a chromosomal arm as shown in the X-axis labels. The Y-axis represents G-score which considers the amplitude of the aberration as well as the frequency of its occurrence across samples. (B) Comparison of fraction of genome altered values across the three NSMP-EC clusters. (C) Comparison of tumor mutational burden (#mutations/megabase) across the three NSMP-UEC clusters. (D) Bar-plots comparing the alteration frequency of 8 commonly altered genes among the three molecular clusters of NSMP-EC. The black horizontal lines marked with a * at the top of each bar-plot represent statistically significant difference in the frequency of the altered gene among the clusters; n.s., not significant. C1, Cluster 1; C2, Cluster 2; C3, Cluster 3.
