
Figure 4. Clonality of somatic mutations in NSMP uterine endometrioid carcinomas and recurrent genomic alterations in non-endometrioid endometrial cancers of NSMP.
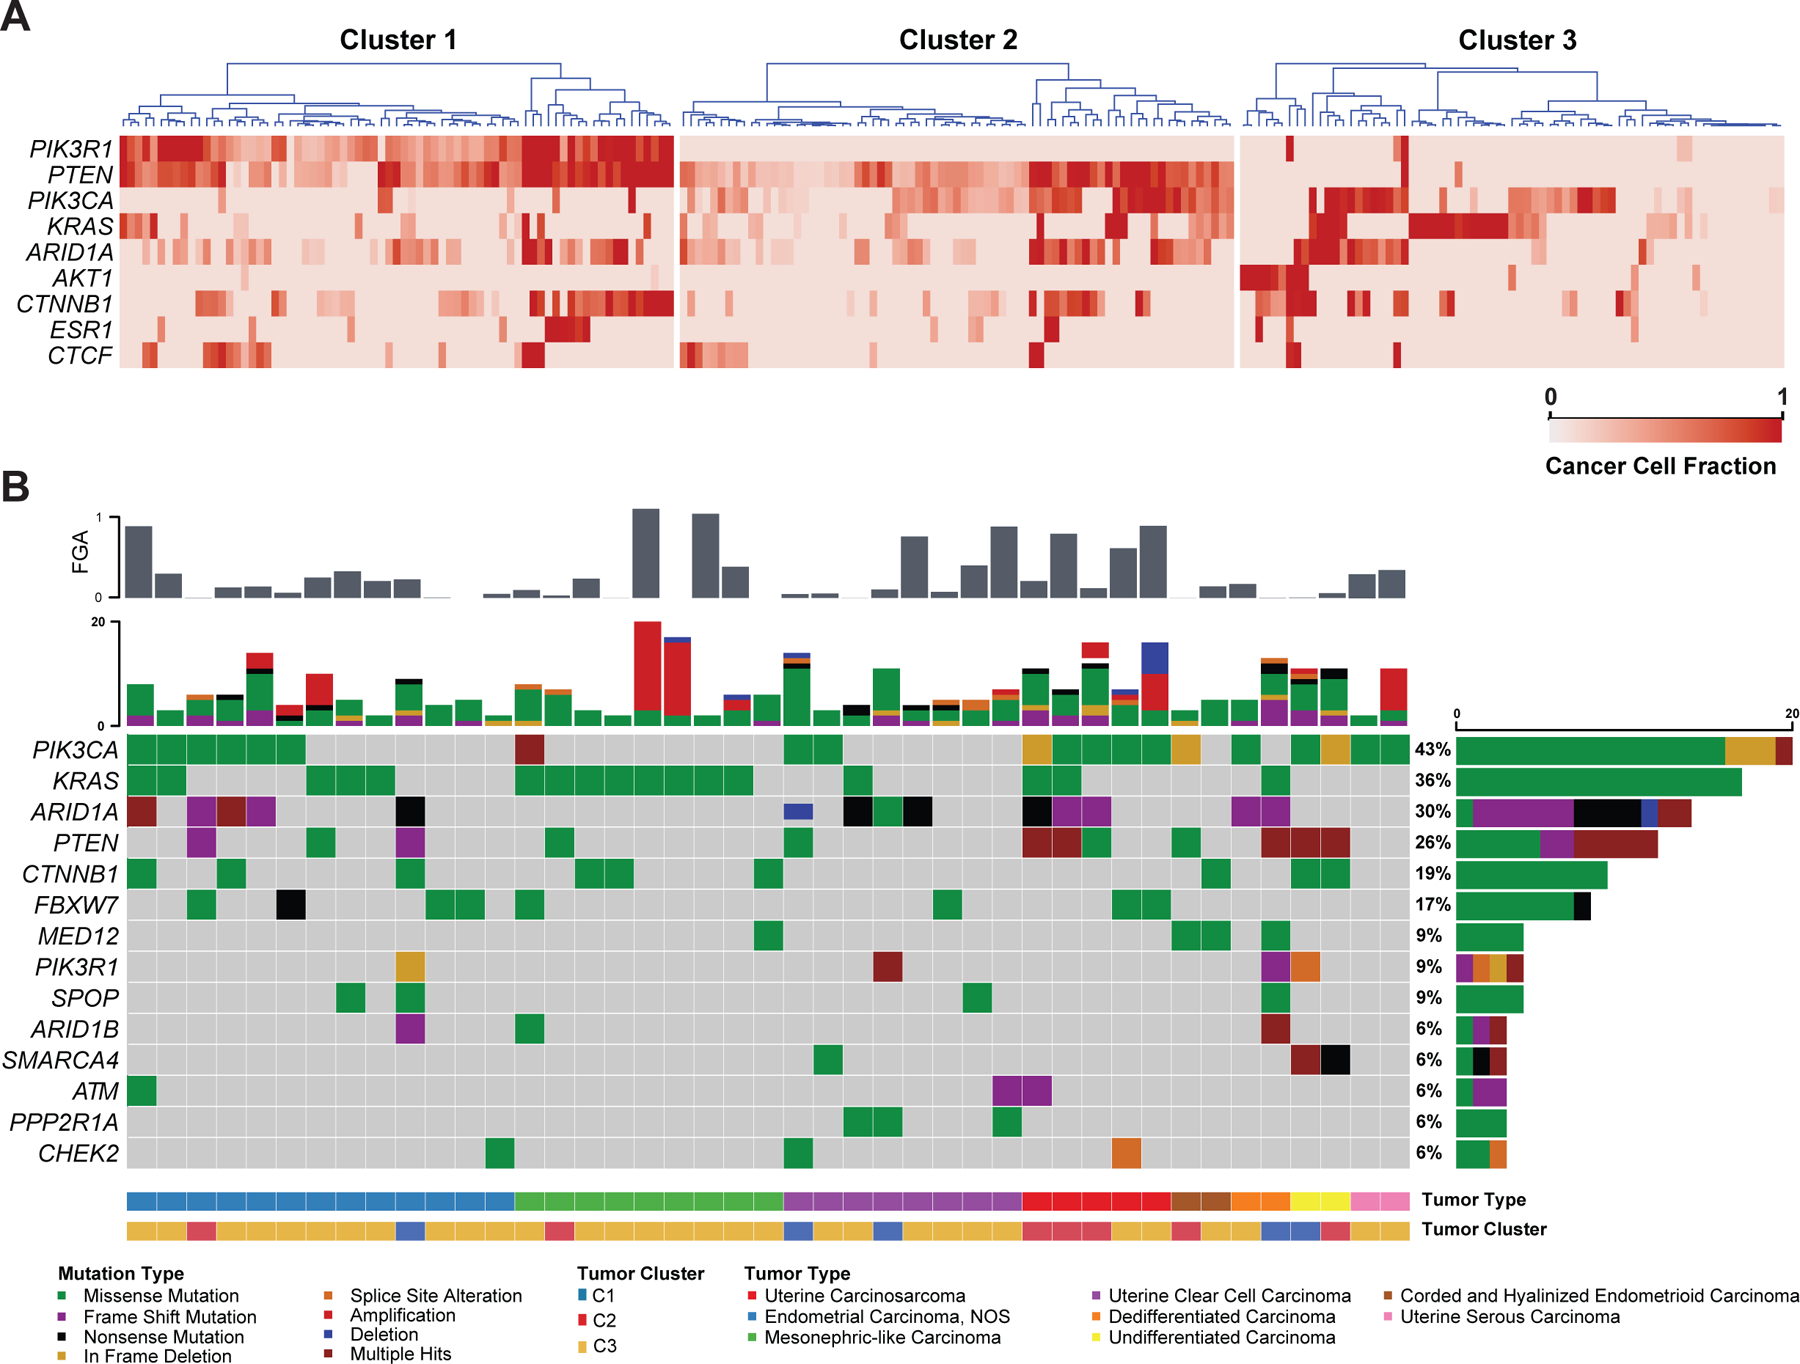
(A) Heatmaps showing the cancer cell fractions of the most commonly altered genes among the three clusters of uterine endometrioid carcinomas of no special molecular profile (NSMP-UEC). Each column represents a tumor. The gradient of the heatmap is based on the calculated cancer cell fraction of the alteration in the sample, color-coded according to the legend. (B) Oncoprint depicting the most recurrent genomic alterations in non-endometrioid endometrial carcinomas of no special molecular profile (NSMP). Each column represents a tumor with the bar graph at the top depicting the number/distribution of alterations per sample, and the Oncoprint rows showing alterations for each gene. The bottom part of the graph shows the summary of histopathologic and clinical information for each case. The bar graph on the right of the panel shows the number and distribution of alterations for each gene. Mutation types and clinicopathologic features are color-coded according to the legend. C1, Cluster 1; C2, Cluster 2; C3, Cluster 3.