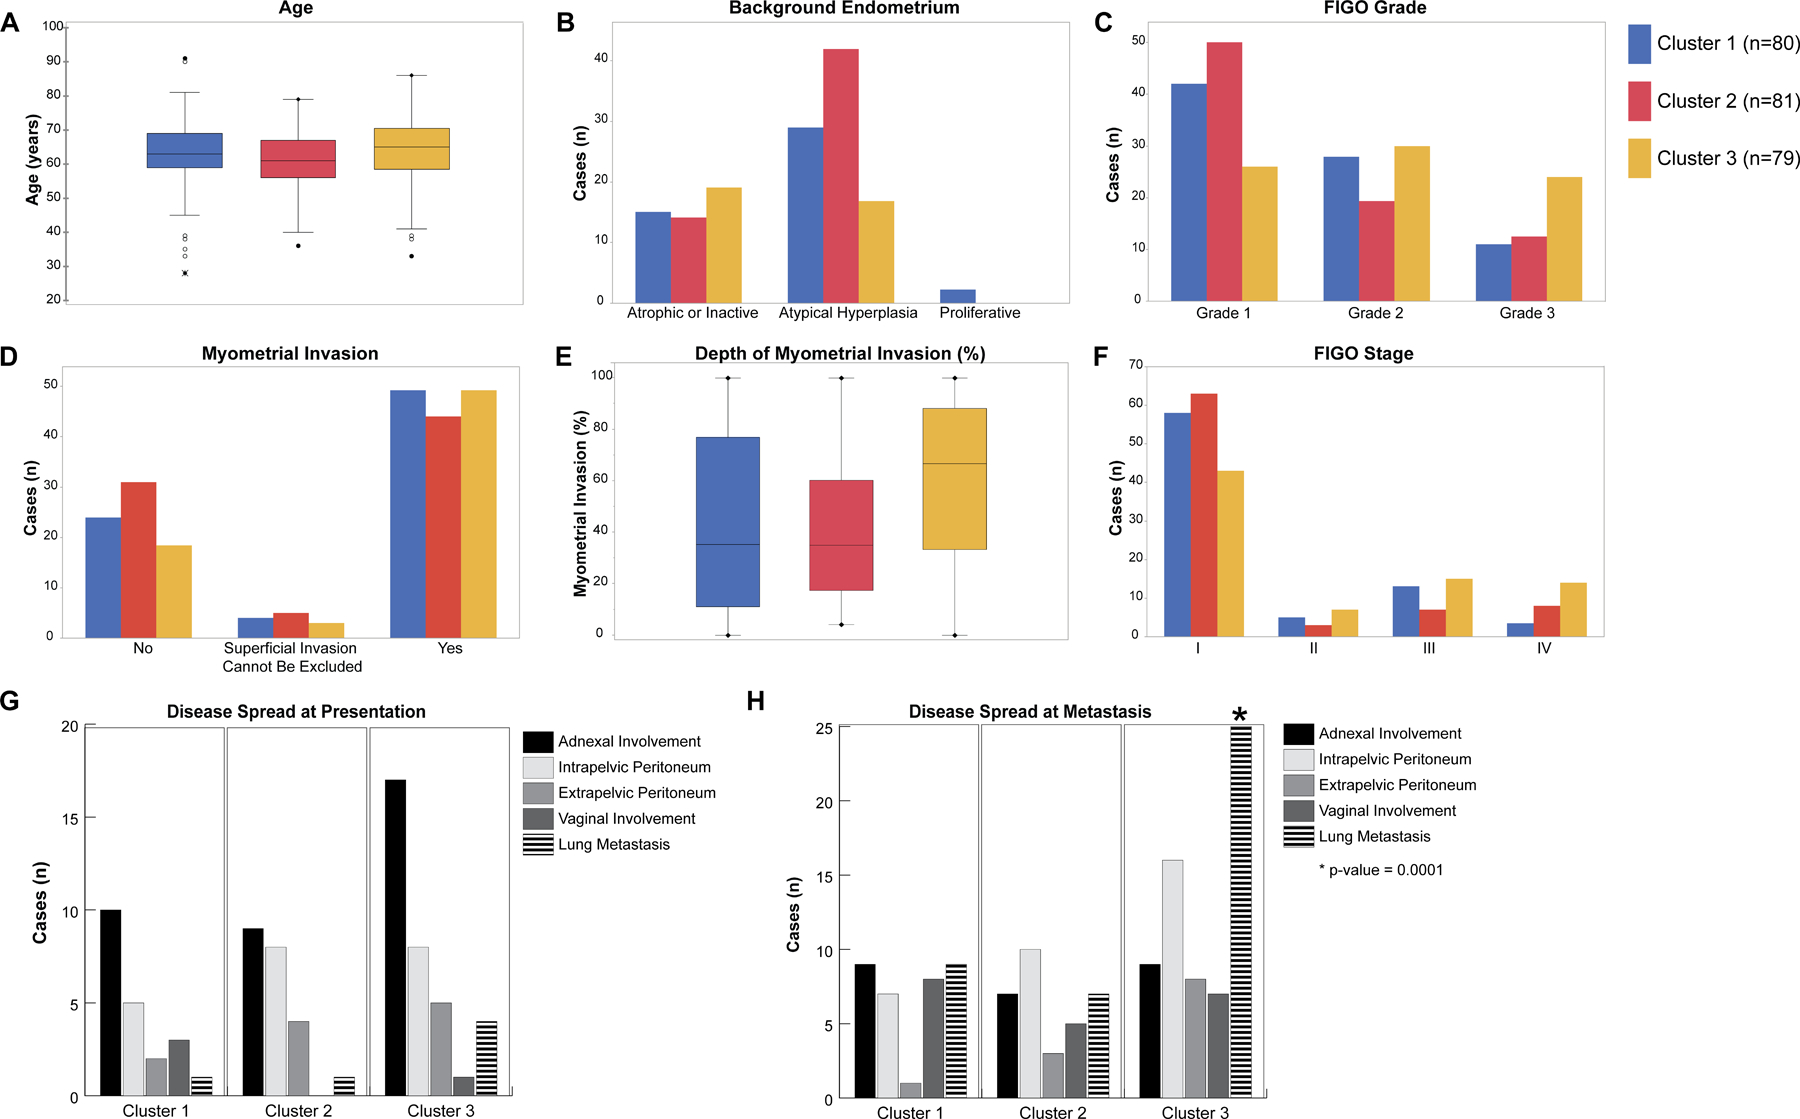
Figure 5. Clinicopathologic features of NSMP uterine endometrioid carcinomas.

(A) Box and whisker plots comparing age distribution between the molecular clusters of uterine endometrioid carcinomas of no special molecular profile (NSMP-UEC). (B) Bar-plot comparing the background endometrium findings among the molecular clusters. (C) Bar-plot comparing the tumor FIGO grade among the molecular clusters. (D) Bar-plot comparing the distribution of myometrial invasion among the molecular clusters. (E) Box and whisker plots comparing the depth of myometrial invasion among the molecular clusters. (F) Bar-plot comparing the distribution of tumor FIGO clinical stage among the molecular clusters. (G) Bar-plot comparing the tumor spread at the time of diagnosis among molecular clusters. (H) Bar-plot comparing the tumor spread at the time of recurrence among molecular clusters. Molecular clusters are color coded with blue representing Cluster 1, red representing Cluster 2 and yellow representing Cluster 3 tumors.
