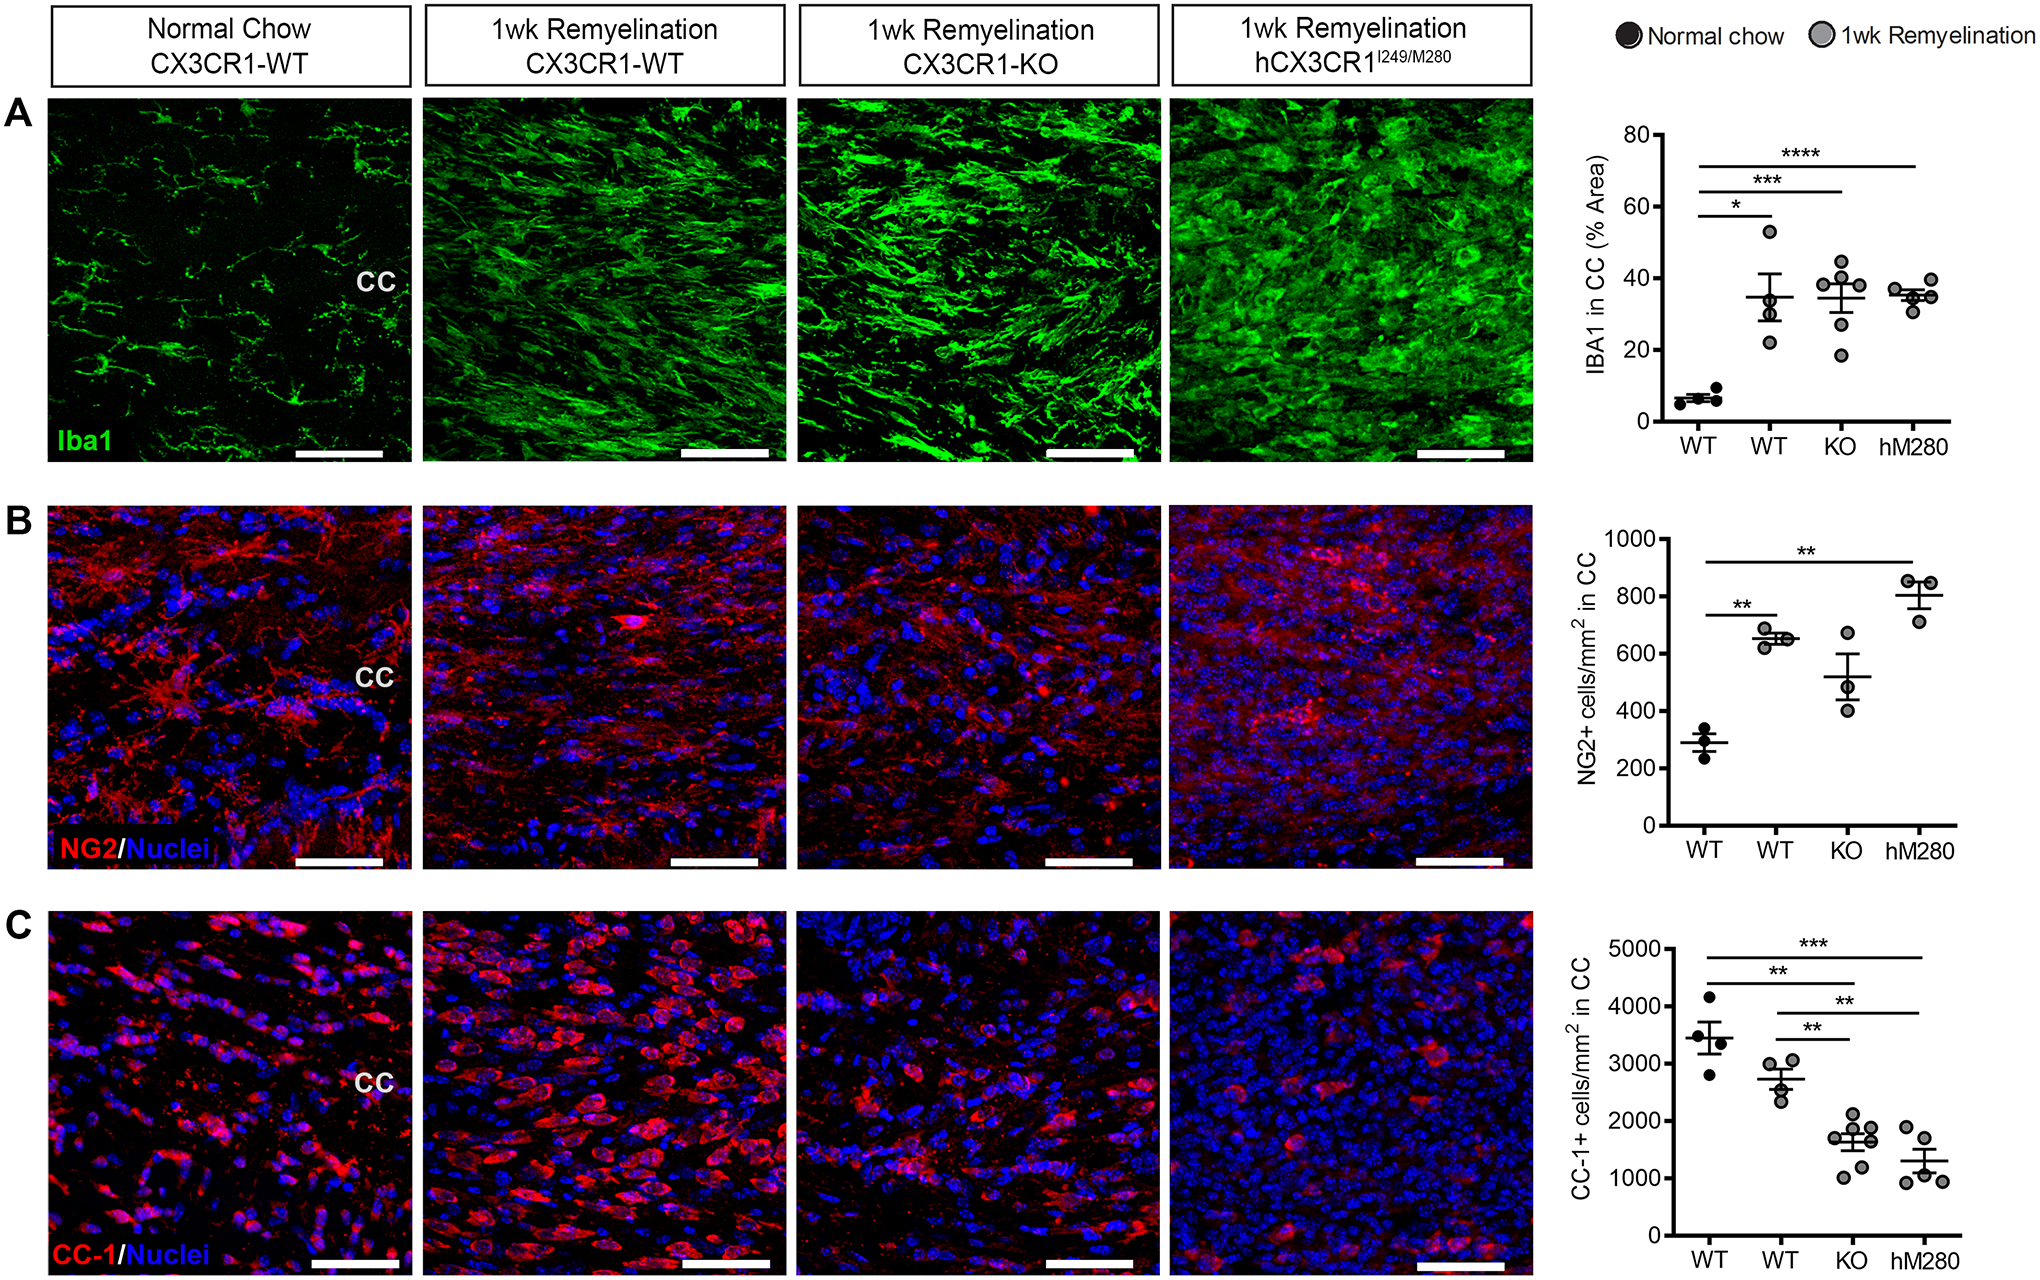
Figure 5. Fractalkine signaling supports oligodendrocyte differentiation following cuprizone-mediated demyelination.

A-C, Confocal images of (A) Iba1+ microglia (green), (B) NG2+ cells (red), (C) CC-1+ mature oligodendrocytes (red) at the corpus callosum in sections from CX3CR1-WT (WT), CX3CR1-KO (KO), and hCX3CR1I249/M280 (hM280) mice following 1 wk remyelination or in control mice fed normal chow. Nuclei were labeled with Hoechst stain (blue). Image quantification is shown on right. Data are mean ± SEM, n = 3 to 7 mice per group where each dot represents an individual mouse. *P<0.05, **P<0.01, ***P<0.001, ****P<0.0001 using Student’s t-test, with Welch’s correction. Scale bars: 50 μm.
