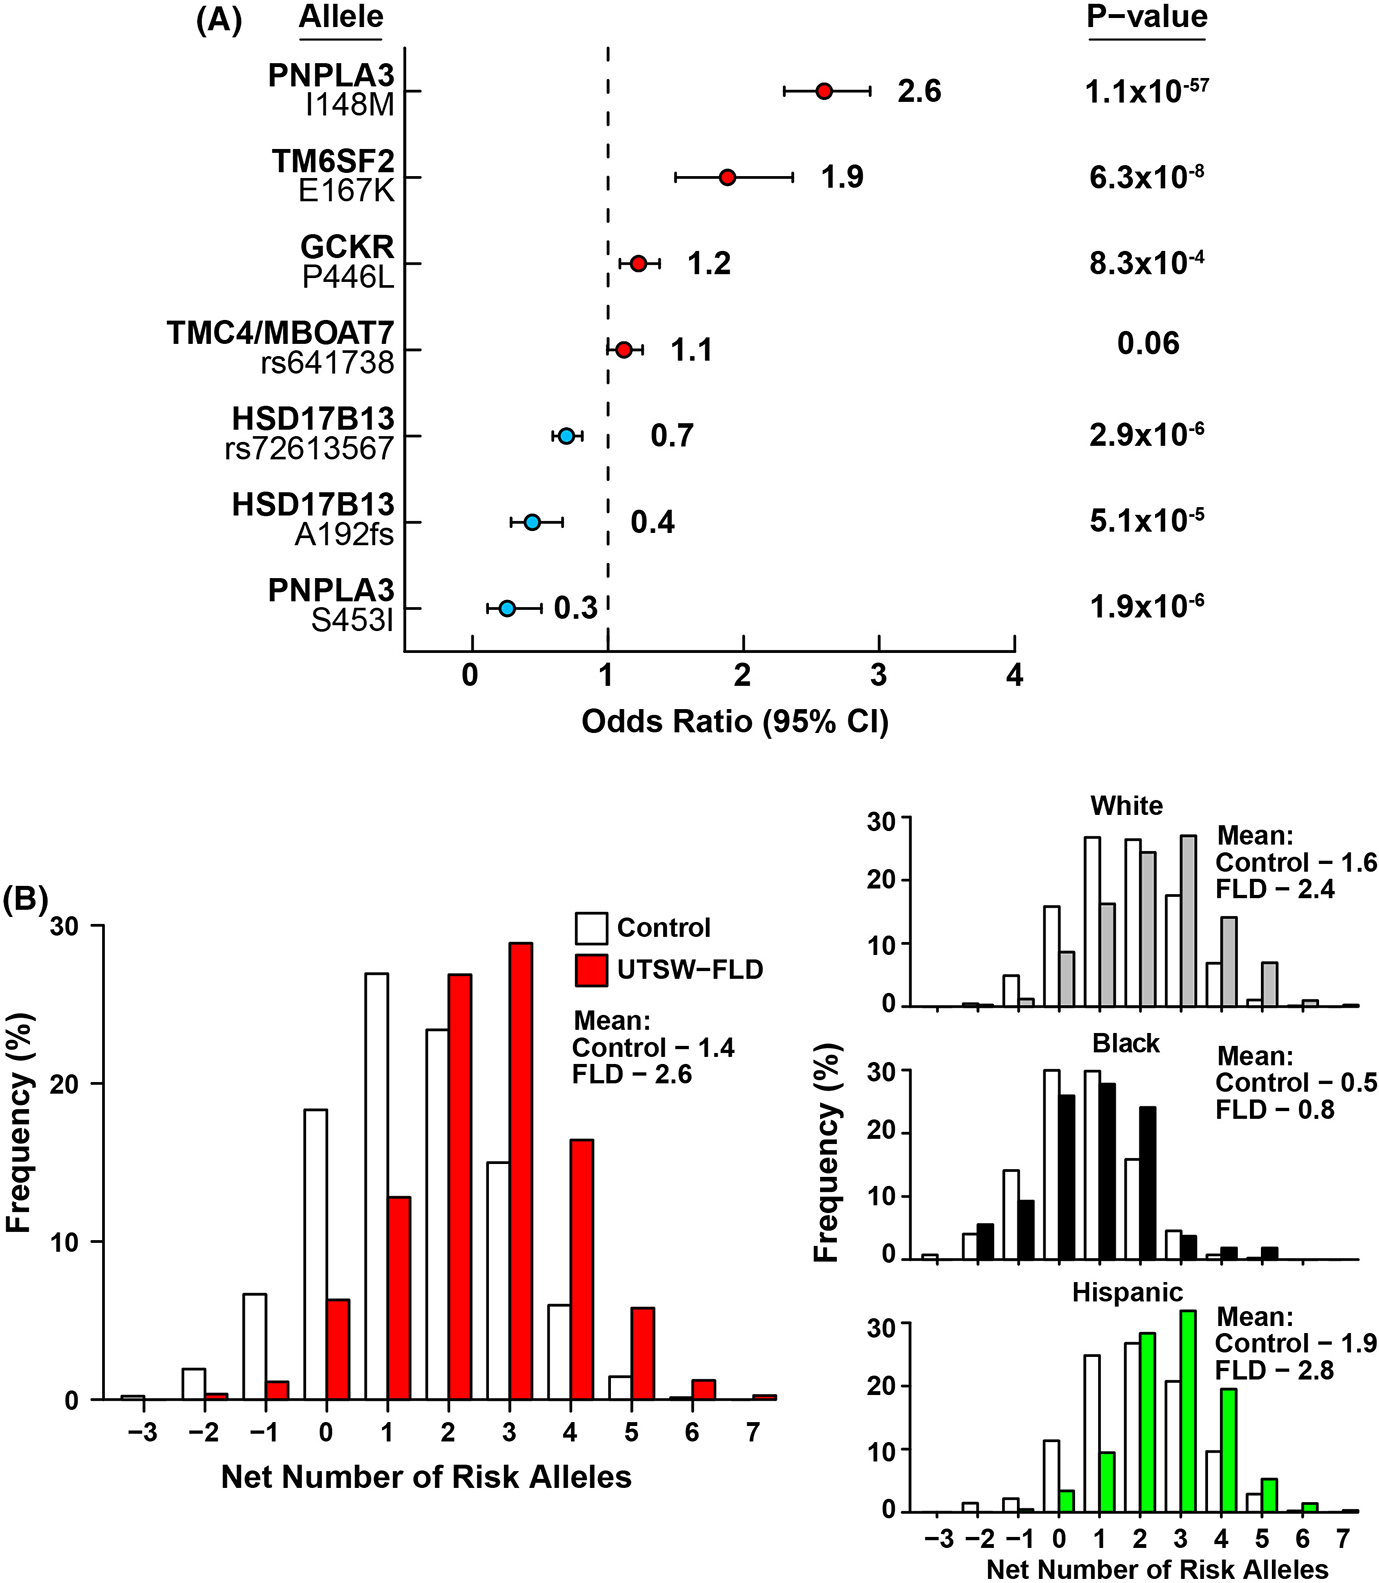
FIGURE 2.

(A) Comparison of risk allele frequencies between UTSW-FLD Cohort participants and controls. Analysis was performed using logistic regression analysis, adjusted for age, gender, BMI and T2DM. (B) Distribution of number of risk alleles in controls and cases in the pooled cohort and after ethnic stratification.
