
Figure 1. Immunohistochemical characteristics of SCLC-P.
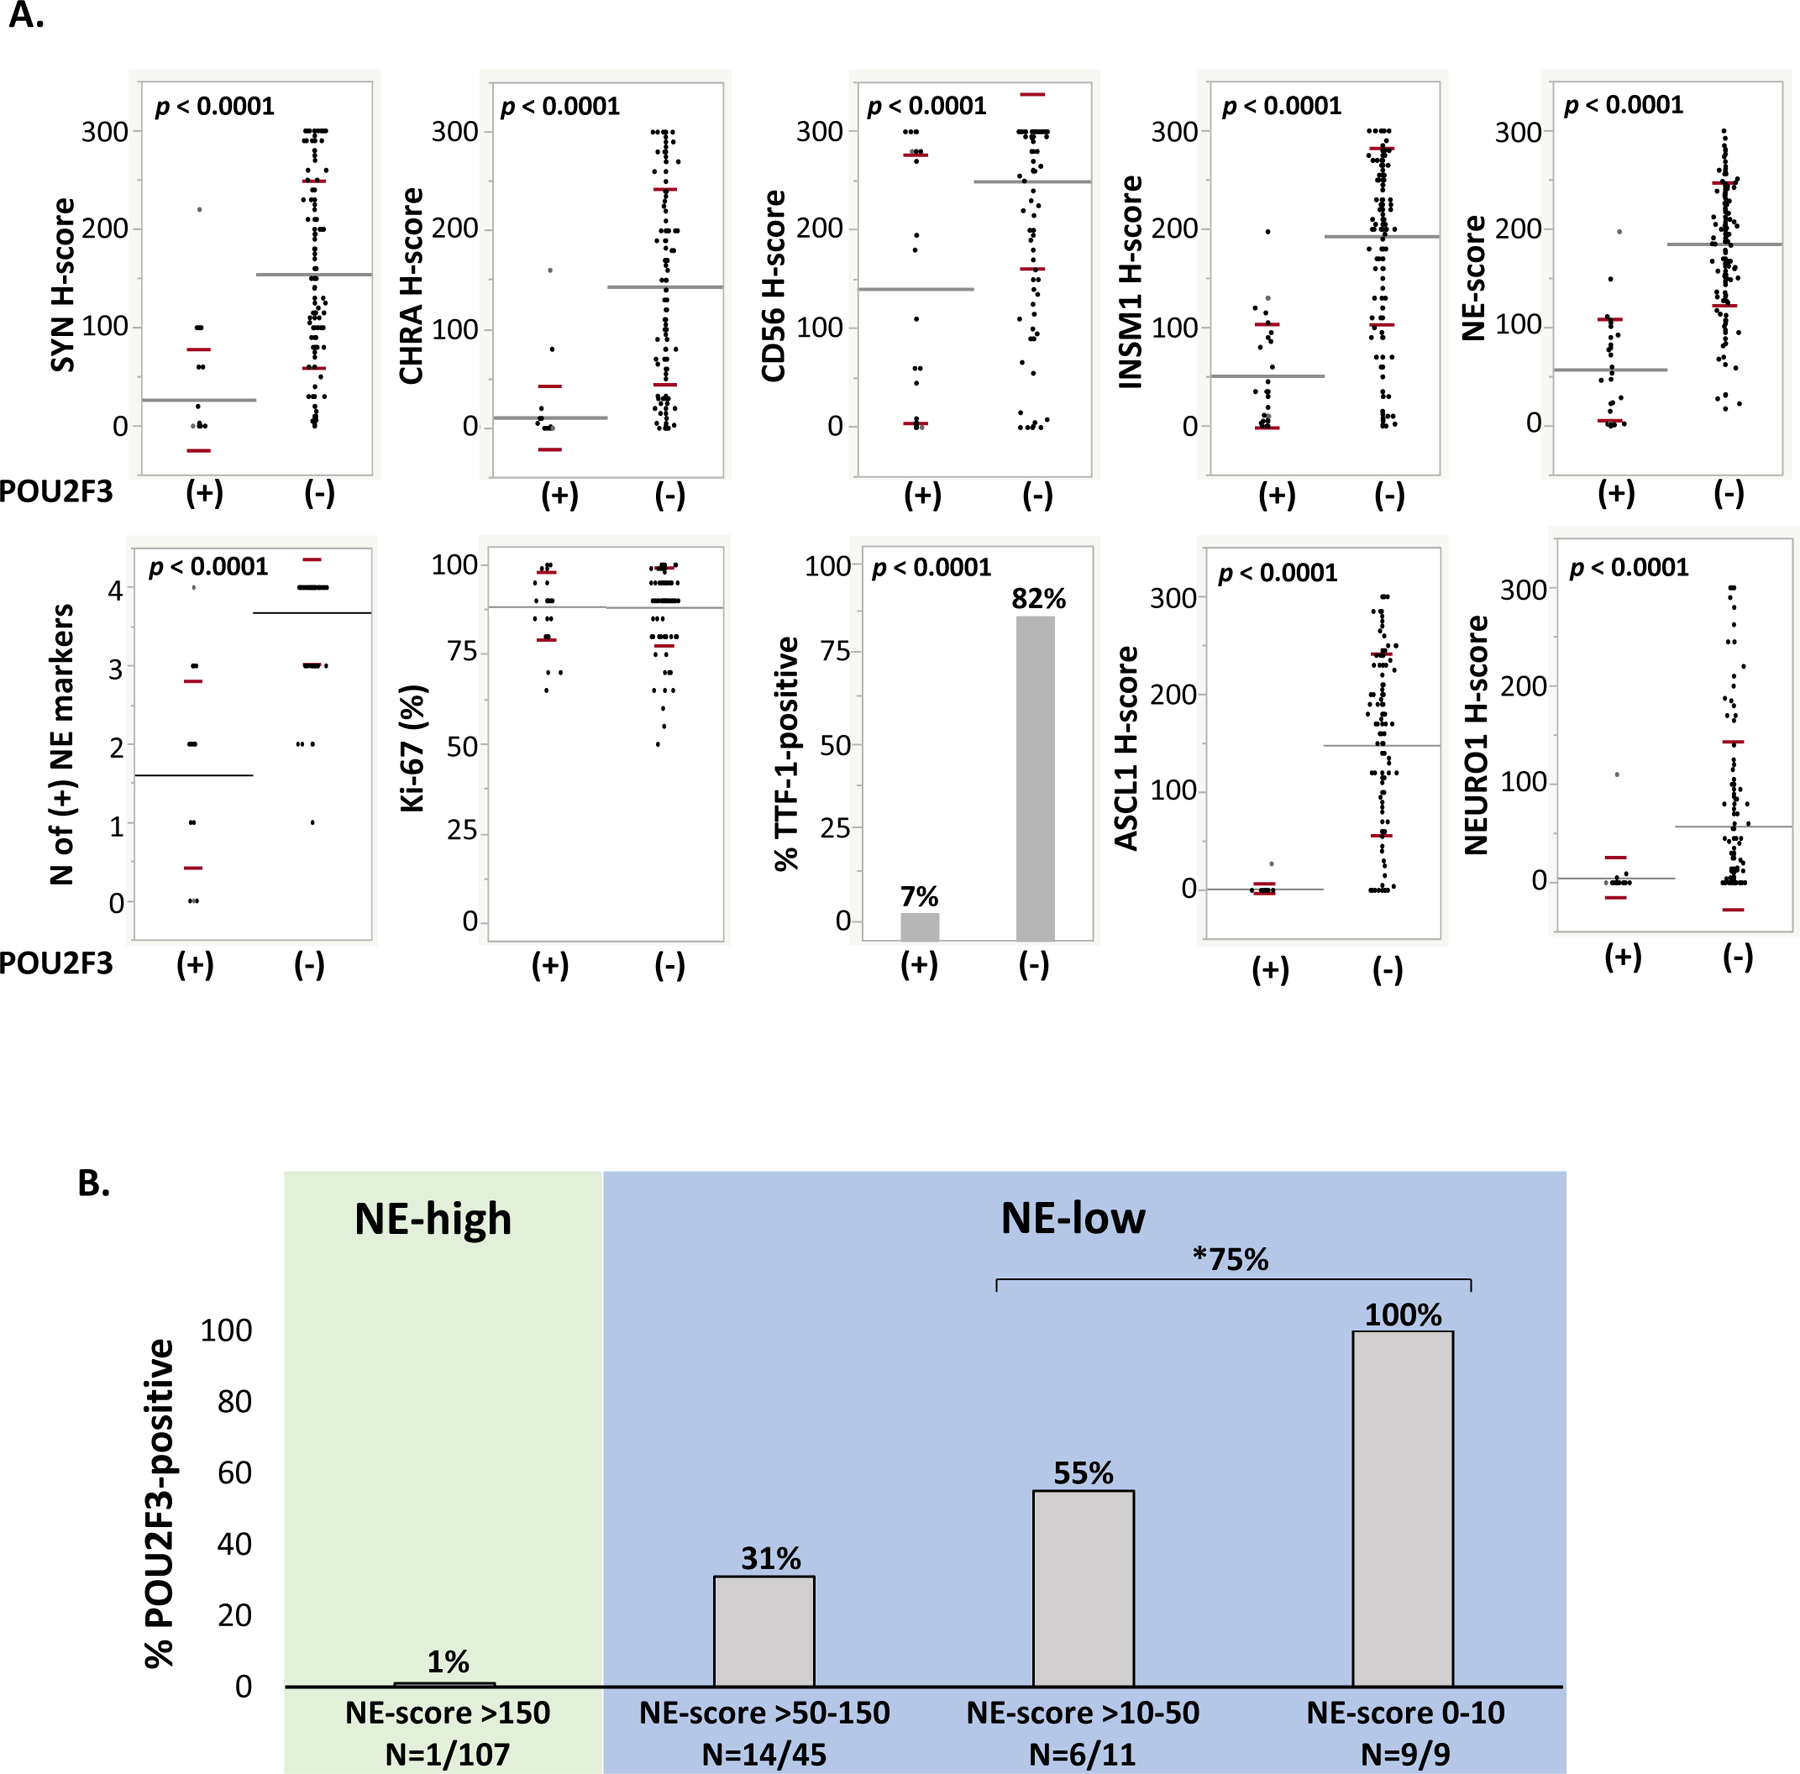
(A) Dot plots depicting expression of various markers in POU2F3-positive (n=30) versus POU2F3-negative SCLC (n=142 for all markers, except n=127 for Ki67 and n=122 for TTF-1). Mean and standard deviation for each comparison are graphically depicted by grey and red lines, respectively (see Supplementary Table 3 for details). (B) Bar graph depicting the proportion of POU2F3-positive cases among SCLC groups defined by extent of NE marker labeling, as expressed by the NE-score (average H-score for all four conventional NE markers: synaptophysin, chromogranin A, CD56, and INSM1). *75% refers to proportion of POU2F3-positive cases among all NE-extremely low/negative SCLC (H-score 0–50).
Abbreviations: CHRA chromogranin A, NE neuroendocrine, SYN synaptophysin