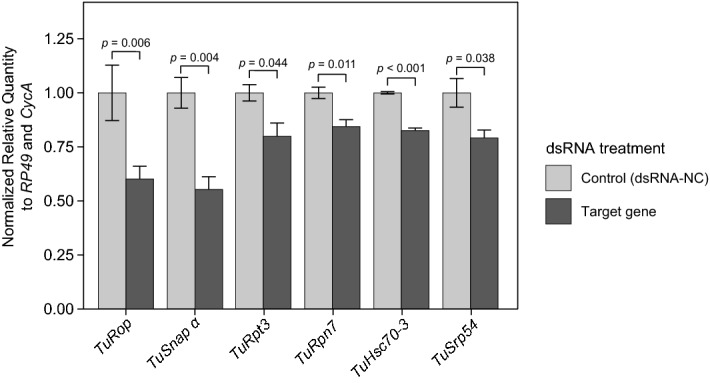
Figure 2.

Target gene knockdown after dsRNA treatment. Average gene expression level relative to the expression of the reference control genes RP49 and CycA. Data represent the mean ± SE. The RT-qPCR analysis was assessed at the whole mite level and was conducted in three independent experimental runs. Statistical analysis was performed using unpaired two-tailed t test (exact P-values corresponding to each pairwise comparison between the control and the treatment are displayed).
