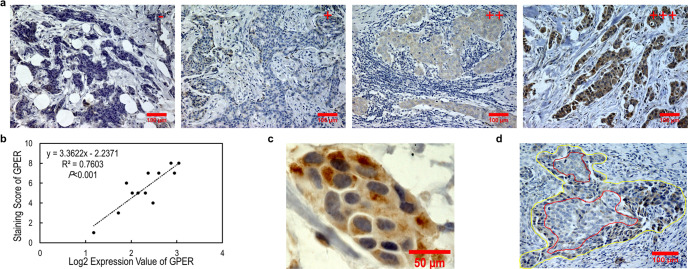
Fig. 1. Immunohistochemical staining for GPER.
a Immunohistochemical staining for GPER with different intensity. The staining is graded as negative (−), weak (+), moderate (++), and strong (+++). Scale bar, 100 μm. b Scatter plots show that the IHC score is linearly correlated with the log2 expression value of GPER in the results of Pearson correlation coefficient calculation, which is statistically significant. Pearson correlation coefficient R2 and p-value are given in the scatter plot. c Image showing IHC staining of GPER is only observed in cytoplasmic. Scale bar, 50 μm. d Representative image of weak GPER staining in the core area and strong GPER staining in the corresponding margin. Scale bar, 100 μm.

