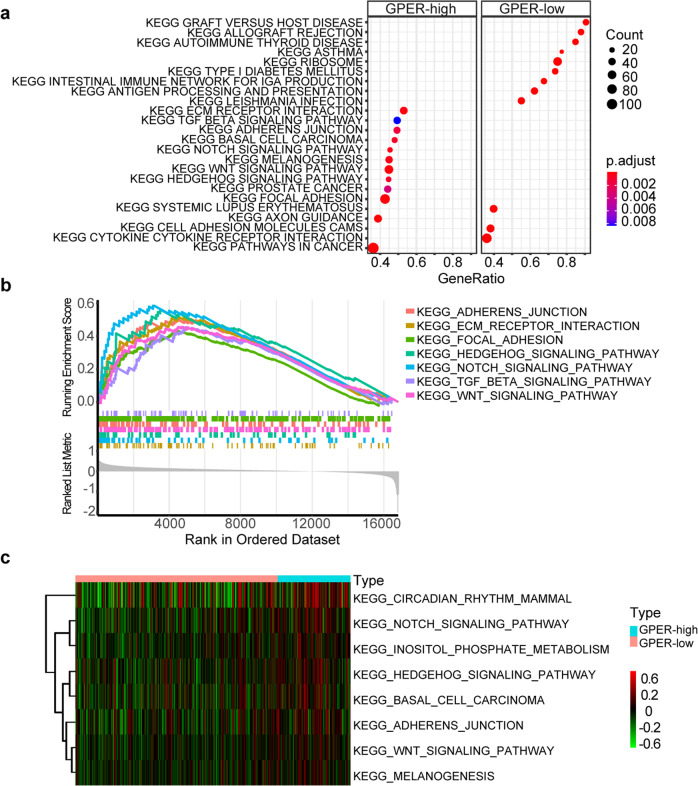
Fig. 5. The GSEA and GSVA results of GPER correlated pathways based on the transcriptomic data of 360 TNBC patients.
a Dotplot showing the twelve most significantly upregulated pathways in GPER-high and GPER-low groups from GSEA results. In the group of high GPER expression, seven of the twelve upregulated pathways are correlated with promoting tumor metastasis. b GSEA-plots showing the upregulated pro-metastatic pathways in the GPER-high group. c Heatmap for the eight most significantly upregulated pathways in GPER-high group by GSVA. Statistically significant differences were defined as adjusted P-value < 0.05.

