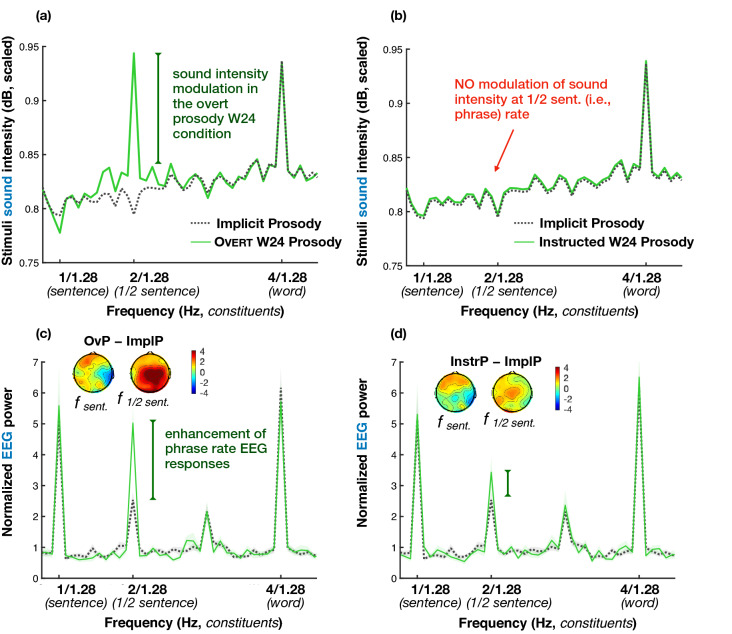
Figure 5.
EEG results for the 2 + 2 Syntax sentences with the prosodic contour aligning with their syntactic structure plotted against the data from the same 2 + 2 Syntax sentences in the Implicit Prosody condition (ImplP, dotted grey lines): Overt Prosody (OvP, left column) and Instructed Prosody (InstrP, right column) conditions. The top row (a,b) represents the spectrum of sound intensity envelopes of the spoken sentence materials, the bottom row depicts EEG power in listeners (c,d). The lines in the spectrum plots reflect group averages, with the shaded area depicting standard errors of the mean. Scalp maps show the scalp distribution of the difference between EEG peaks (calculated as distance from the peak value to surrounding noise) for OvP minus ImplP in (c) and for InstrP minus ImplP in (d) (separately for sentence and ½ sentence frequencies). Key effects are marked with vertical bars: when a prosodic W24 contour is applied to the 2 + 2 sentences in which it aligns with syntactic phrasing (whether overtly or covertly), the EEG responses were enhanced compared to the ImplP condition.

