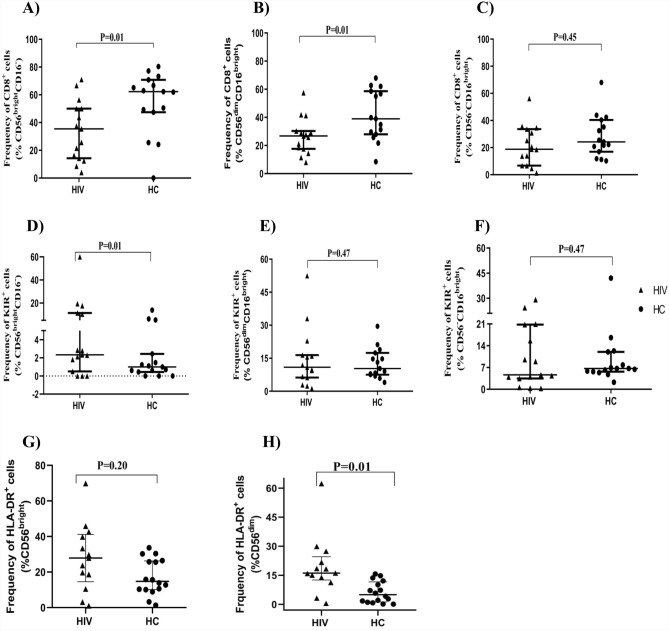
Figure 4.
Frequency of KIR3DL1/S1+, CD8+ and HLA-DR cells among NK cells subsets. The frequency of CD8+ and KIR3DL1/S1+ cells within the CD56brightCD16−ve (A,D), CD56dimCD16bright (B,E) and CD56−veCD16bright (C,F) subsets are depicted for both HIV (n = 15) and HC groups (n = 15). The frequency of HLA-DR positive cells is shown for CD56bright (G) and CD56dim (H) subsets (n = 13, HIV group, n = 16 HC group). Mann–Whitney tests were performed with a p-value < 0.05 considered statistically significant. The median and 25th and 75th percentile are indicated on each plot.

