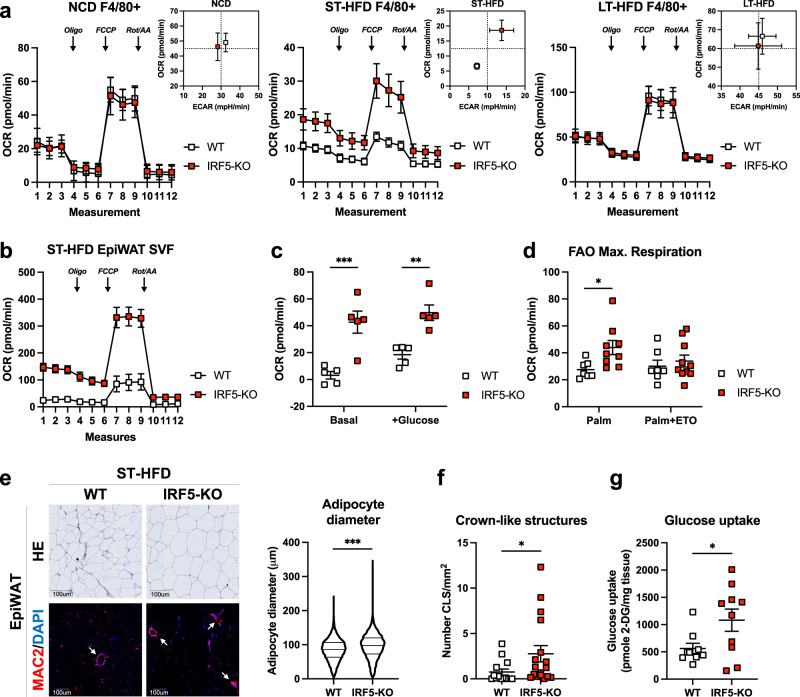
Fig. 2. Increased mitochondrial respiration in IRF5-deficient macrophages alters adipose tissue phenotype and function upon short-term high-fat diet.
a Oxygen consumption rate (OCR) from extracellular flux analysis, following Oligomycin (Oli), carbonyl cyanide 4-(trifluoromethoxy) phenylhydrazone (FCCP) and Rotenone/Antimycin A (Rot/AA) treatments, from epididymal white adipose tissue (EpiWAT) magnetically sorted F4/80+ cells from WT and IRF5-KO mice on normal chow diet (NCD; left), short-term (ST-) high-fat diet (HFD; middle) and long-term (LT-)HFD (right). Energetic plot with Extracellular acidification rate (ECAR) and OCR from maximal respiration (n = 4 mice per genotype for NCD, n = 6 WT and 8 IRF5-KO mice for ST-HFD and n = 5 WT and 4 IRF5-KO mice for LT-HFD). b OCR from extracellular flux analysis, following Oligo, FCCP and Rot/AA treatments, from EpiWAT stromal vascular fraction (SVF) of WT and IRF5-KO mice on ST-HFD (n = 5 mice per genotype). c OCR from extracellular flux analysis under basal conditions and following addition of glucose, performed on the EpiWAT SVF of WT and IRF5-KO mice on ST-HFD (n = 5 mice per genotype, ***p = 0.0002 and **p = 0.0018 two-way ANOVA). d Maximal OCR from Fig. S4B of fatty acid oxidation (FAO) test on EpiWAT SVF from WT (n = 7) and IRF5-KO (n = 9) mice on ST-HFD (*p = 0.035, one-way ANOVA). Palm palmitate, ETO etomoxir. e Representative images of hematoxylin and eosin (HE) staining for adipocyte size and MAC2/DAPI immunostaining to visualise crown-like structures (white arrows), on EpiWAT sections of WT and IRF5-KO mice on ST-HFD (scale bar = 100 um). Right: adipocyte size quantification on the HE staining (data pooled from biologically independent replicates, n = 20 WT and 21 IRF5-KO mice, two-tailed unpaired t-test, ***p = 0.0001). f Crown-like structure quantification on MAC2/DAPI immunostained EpiWAT sections of WT and IRF5-KO mice on ST-HFD (n = 14 WT and 17 IRF5-KO mice, two-tailed unpaired t-test Welch’s correction, *p = 0.0472). g Glucose uptake assay performed on EpiWAT explants from WT and IRF5-KO mice on ST-HFD (n = 9 WT and 10 IRF5-KO mice, two-tailed unpaired t-test Welch’s correction, p = 0.038). Data presented as mean ± SEM. Source Data file provided.

