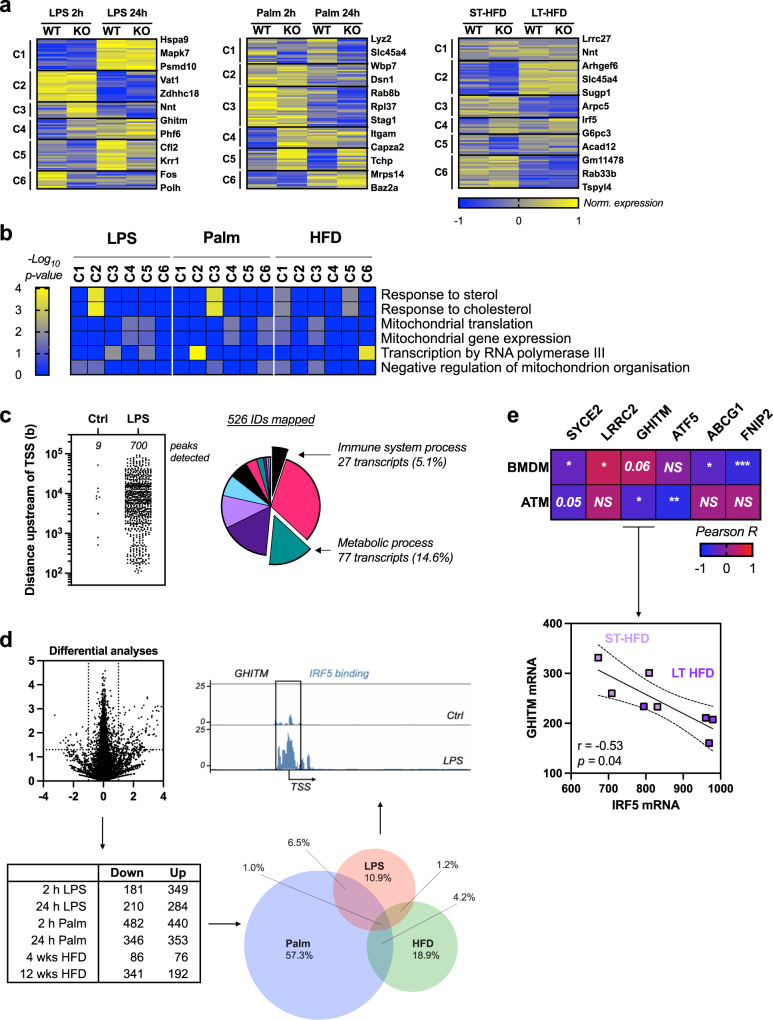
Fig. 5. IRF5 binds to and regulates expression of genes that control mitochondrial structure and metabolism in bone-marrow-derived macrophages and adipose tissue macrophages in response to metabolic stress.
a Clustering analysis on RNA sequencing from bone-marrow-derived macrophages (BMDM) from IRF5-KO and WT mice treated for 2 or 24 h with bacterial lipopolysaccharides (LPS) or palmitate (Palm) and epididymal white adipose tissue (EpiWAT) F4/80+ macrophages (ATMs) from IRF5-KO and WT mice following short-term (ST-) or long-term (LT-) high-fat diet (HFD). Clustering analyses was applied to genes differentially expressed between genotypes in at least one condition. b Gene ontology (GO) term enrichment, related to mitochondria and lipotoxicity. Genes from differentially regulated clusters in panel a and Fig S7A (Binomial test of gene list compared to species reference genome). c Publicly available chromatin immunoprecipitation (ChIP) seq of IRF5 in BMDMs treated with LPS for 120 min was procured. Peaks of interest were determined as either at or upstream of transcription start sites (TSS). Annotated genes were subjected to gene ontology (GO) enrichment analyses. d Differential analysis between genotypes per treatment: 2- or 24-h treatment with LPS or Palm and in EpiWAT ATMs following ST- or LT-HFD (Wald test p-value <0.05, equivalent to −log10 p-value > 1.3, and Log2FC > 1.0). Venn diagram of differentially expressed genes between genotypes, per treatment condition. Percentage refers to proportion of genes in overlap. Gene track from ChIP-seq in c. of GHITM gene which overlaps all conditions and also bound by IRF5. e Correlative analyses of IRF5 expression and the expression of previously identified overlapping genes in d; and notably GHITM expression in ATMs from IRF5-competent mice fed a ST- or LT-HFD (Pearson’s correlation, Pearson r = −0.83, two-tailed p = 0.009). Data presented as mean ± SEM. Source Data file provided.

