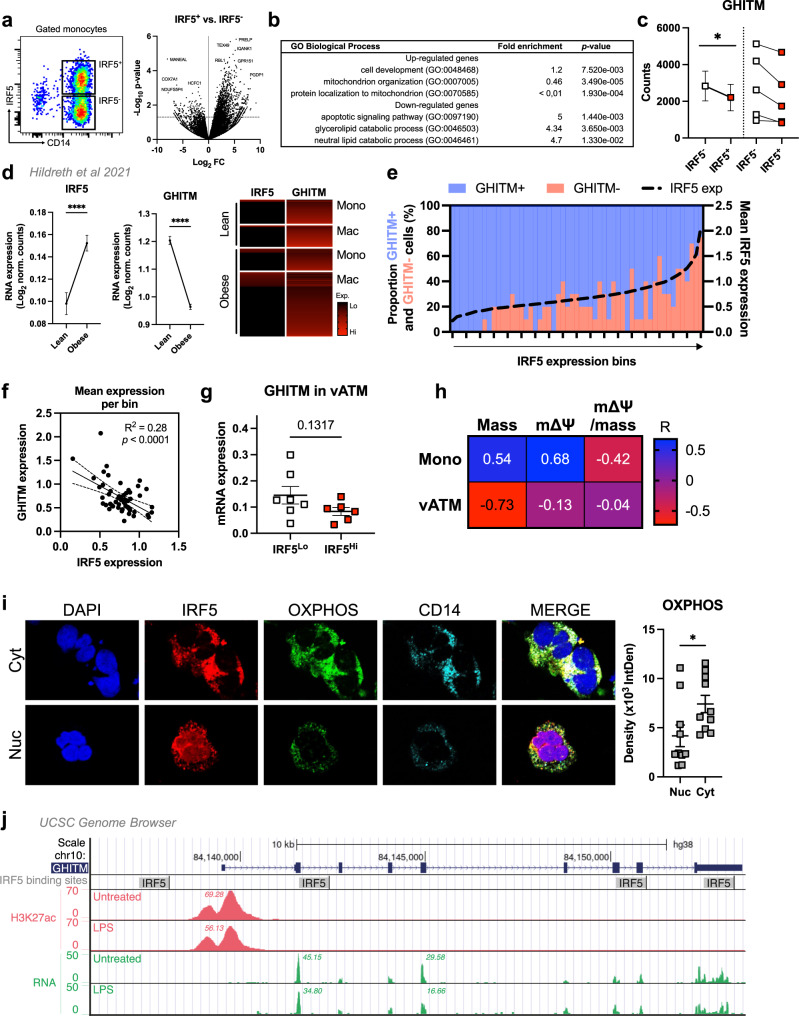
Fig. 7. IRF5 binds to GHITM and regulates mitochondrial activity in human monocytes and adipose tissue macrophages.
a CD14+ Monocytes from patients with type-2 diabetes (T2D; n = 5) were sorted based on expression of IRF5 for RNA-seq. Differential analyses were paired by patient and carried out on IRF5+ versus IRF5- monocytes (n = 5, Wald test p-value < 0.05). b Gene ontology (GO) term enrichment from upregulated and downregulated genes in IRF5+ versus IRF5- monocytes. c Expression of Ghitm in IRF5- and IRF5+ monocytes (n = 5, *p = 0.039, two-tailed paired t-test). d Irf5 and Ghitm counts in white adipose tissue (WAT) macrophages and monocytes, from public dataset of scRNA-seq of the stromal vascular fraction (SVF) of patients that are lean or with obesity32 (two-tailed unpaired t-test, ****p < 0.0001). Heatmap of single-cell expression of Irf5 and Ghitm from monocytes (Mon) and macrophages (Mac), each line represents a single cell. e Proportion of Ghitm + (blue) and Ghitm− (red) cells in 10-cell bins by increasing Irf5 expression. f Correlation of Ghitm and Irf5 mean expression per bin (Pearson’s correlation Pearson R2 = 0.28, two-tailed p < 0.0001). g Ghitm expression in CD14+ human visceral adipose tissue macrophages (vATMs). Samples were stratified based on expression of Irf5 into IRF5Lo versus IRF5Hi expressors (IRF5Lo n = 7 and IRF5Hi n = 6, two-tailed unpaired t-test, p = 0.13). h Correlation of IRF5 MFI, JC1-Green (mitochondrial mass, Mt Mass), JC1-Red (mΔΨ), and mΔΨ/mass in vATM from patients with obesity and in monocytes from patients with T2D (Mono) (n = 11 for monocytes, n = 9 for ATMs, Pearson’s correlation, Pearson r shown, p-values in Fig S9D). i Immunofluorescence staining of IRF5 (red), oxidative phosphorylation (OXPHOS) enzyme complexes (green) and CD14 (cyan) in human monocytes from patients with T2D. Nuclei stained visualised with DAPI (blue). Samples were separated based on IRF5 localisation, either nuclear (Nuc) or cytoplasmic (Cyt). Quantification of OXPHOS staining in Nuc and Cyt samples (n = 10 per condition, two-tailed unpaired t-test, *p = 0.0335). j University of California Santa Cruz (UCSC) genome browser51–53 (http://genome.ucsc.edu) tracks at the GHITM locus. JASPAR202054 tracks visualise transcription factor binding sites for IRF5. BLUEPRINT55,56 to visualise RNA expression and H3K27 acetylation marks in LPS-treated and -untreated human monocyte-derived macrophages (session link). Data presented as mean ± SEM. Source Data file provided.

