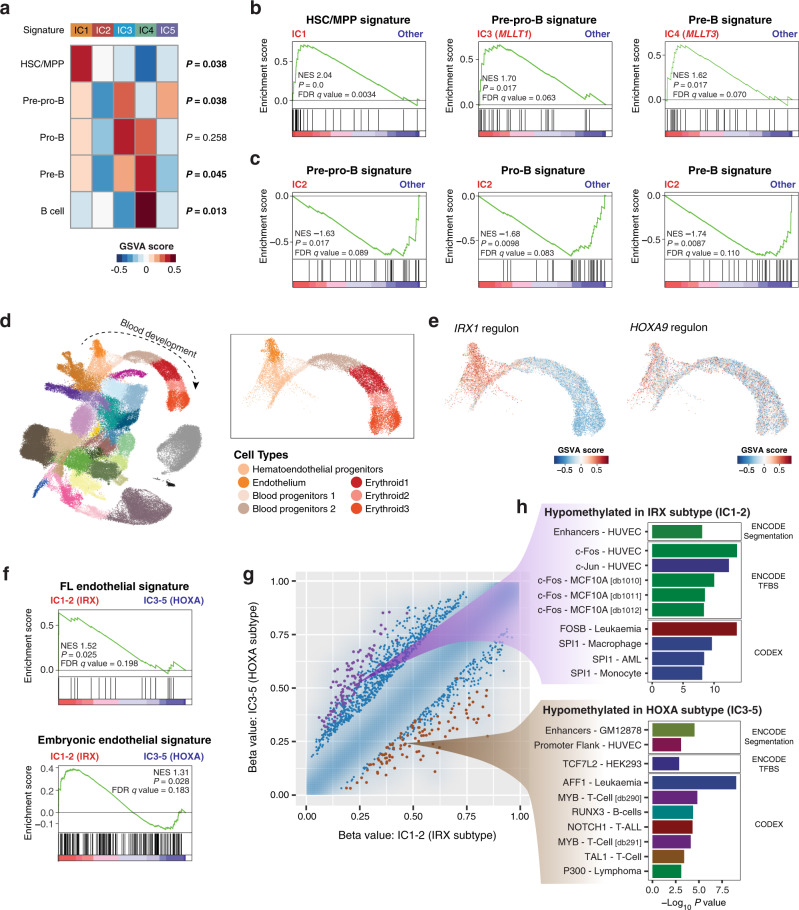
Fig. 3. Differential enrichment of B-lineage and hemato-endothelial developmental signatures in KMT2A-r infant ALL.
a Enrichment analysis comparing the expression of B-cell developmental signatures in the five ICs. Enrichment scores were calculated at the individual sample level using GSVA, and the median value for each signature in each cluster is plotted. Kruskal–Wallis P values are indicated on the right of the heatmap. b Cluster-specific enrichment of B-lineage signatures evaluated with GSEA. NES normalized enrichment score, FDR false discovery rate. c Significant under-enrichment of B-progenitor signatures in IC2. d Uniform manifold approximation and projection (UMAP) visualization of a published single-cell gene expression atlas of murine gastrulation (n = 116,312 cells)26. The right upper box shows a magnified section of the blood development trajectory (n = 13,881 cells). e GSVA enrichment of positive targets of IRX1 and HOXA9 within the blood development trajectory. f Enrichment analysis of endothelial cell signatures comparing IRX subtype vs. HOXA subtype. g Density scatter plot comparing the DNA methylation levels of IRX subtype and HOXA subtype. Differential methylation was assessed on the basis of genomic tiling regions with a 5-kb window. Methylation levels of the tiling regions are shown as density in blue, and individual points are plotted in the 1% sparsest areas of the plot. The 100 most significantly hypomethylated regions in the IRX and HOXA subtypes are shown in purple and brown, respectively. h LOLA enrichment analysis on the 100 differentially methylated regions highlighted in (g). The top ten most significantly enriched categories from CODEX or ENCODE entries of the LOLA Core databases are shown.

