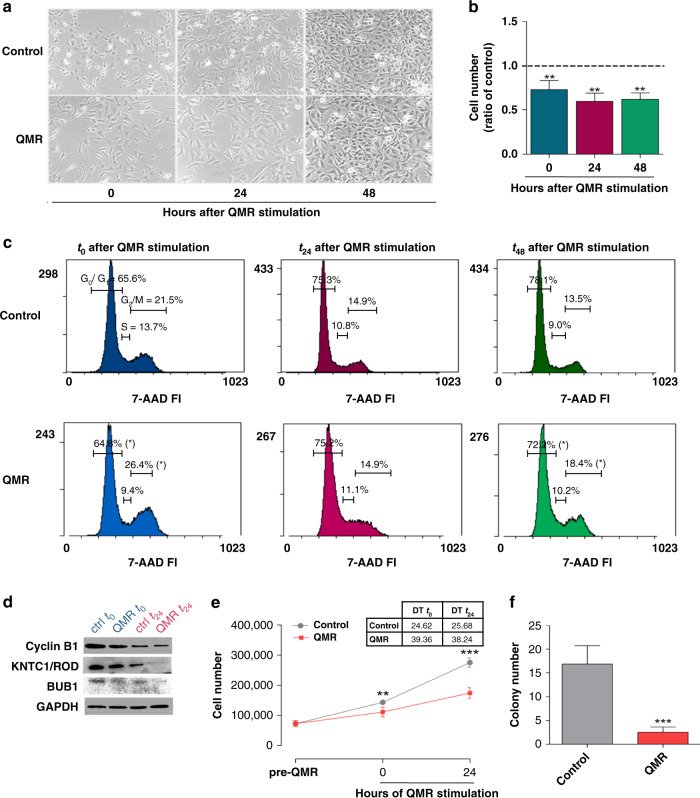
Fig. 1. Effect of QMR stimulation on A172 glioblastoma cells.
a Representative images of A172 at 0, 24 and 48 h after QMR exposure, acquired with an Axiovert 40 CFL inverted light microscope (Carl Zeiss, Oberkochen, Germany; ×10). b Cell viability was detected by trypan blue exclusion assay. Histograms represent the ratio of viable cells relative to that in unstimulated cells. c Cell cycle progression at 0, 24, and 48 h after QMR stimulation was monitored by flow cytometry. Representative cytograms report the percentage of cells in each cell cycle phase (G0–G1, S, G2–M). d Protein expression of cell cycle key regulators was evaluated by WB at t0–t24. GAPDH was used as a loading control. e A172 proliferation curves under basal conditions or after QMR treatment. Cells were counted before QMR and 0, 24 h after stimulation. T48 was not assessed because of technical/instrumental limits. Doubling times (DT) of control and stimulated cells are reported in the table. f A172 colonies were labelled with calcein and counted under an Axiovert 40 CFL inverted light microscope (Carl Zeiss, Oberkochen, Germany). Results are expressed as mean ± SD of at least four independent experiments. *P < 0.05, **P < 0.01, ***P < 0.001; QMR vs control.

