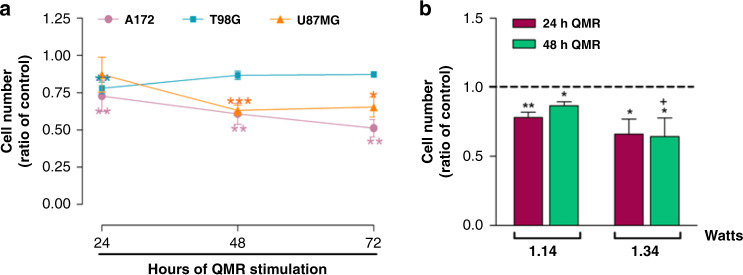
Fig. 3. Effects of QMR on the A172, T98G and U87MG cell lines.
a Cell viability was evaluated after 48 and 72 h of QMR stimulation of all cell lines. b The T98G cell line was treated with 15% greater power, and the proliferation rate was evaluated after 24 and 48 h of stimulation. The results are expressed as mean ± SD of two to four independent experiments. *P < 0.05, **P < 0.01, ***P < 0.001; QMR vs control. +P < 0.05; 1.34 watts vs 1.14 watts.

