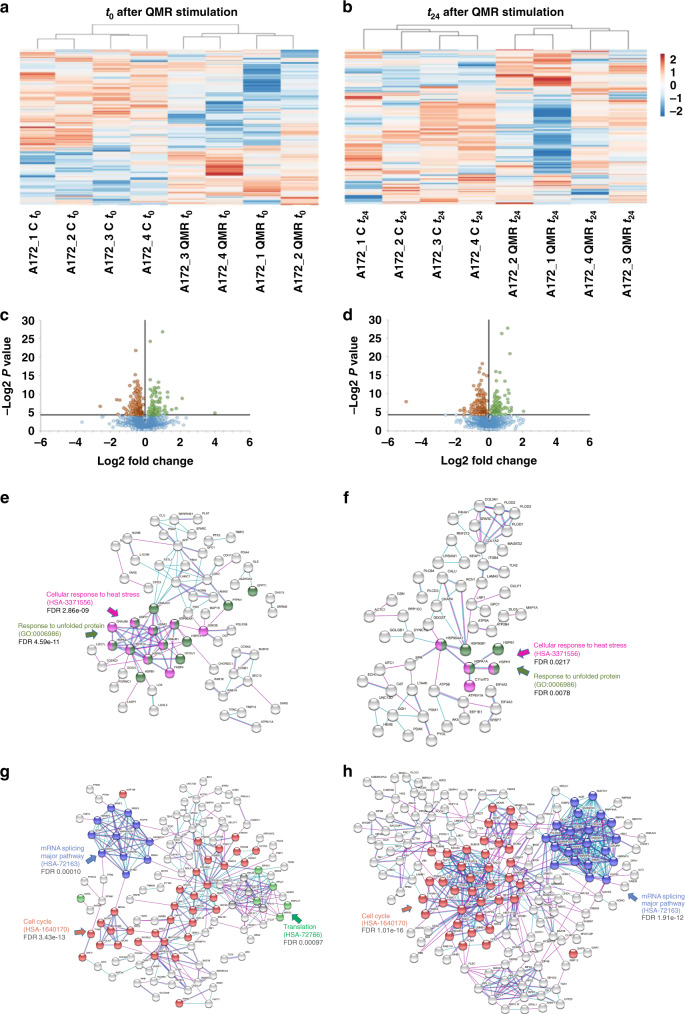
Fig. 4. A172 proteomic profile after QMR stimulation.
a, b Heatmaps of differential protein expression in A172 cells following QMR stimulation at t0 (a) and t24 (b). Red shading indicates upregulated proteins; blue shading indicates downregulated proteins. The threshold for significance was P < 0.05. c, d Volcano plots of differentially expressed proteins in QMR-stimulated vs unstimulated cells. Plots represent differential protein abundance in cells collected at 0 (c) and 24 h (d) after QMR exposure. The −log2 P value is plotted against the log2 fold change (QMR/control). The horizontal line represents the significance threshold in the logarithmic scale. e–h Networks of upregulated (e, f) and downregulated (g, h) proteins in QMR-stimulated A172 cells versus untreated cells at t0 (e–g) and t24 (f–h). Schematic views of known and predicted protein interactions according to the STRING database v. 11.0 (https://www.string-db.org). Only interactions with the medium confidence score (0.4) are shown. Each node represents a protein, and each line represents an interaction. The results derive from at least four independent experiments.

