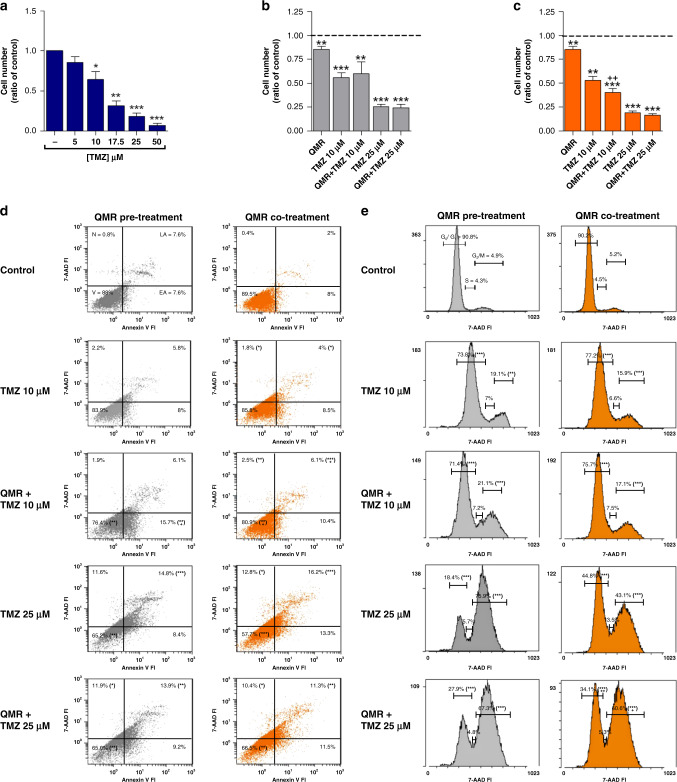
Fig. 6. Effect of QMR and TMZ treatments on A172 cell viability, apoptosis and cell cycle.
In total, 10–25 µM TMZ was administered for 144 h alone (a) or in combination with 24 h QMR (b–e). Grey histograms/dot plots represent TMZ administration after QMR stimulation, while orange histograms/dot plots are representative of the concomitant treatments. Cell viability (a–c) was evaluated by trypan blu exclusion assay, while apoptosis (d) and cell cycle (e) were monitored by flow cytometry. The results are expressed as mean ± SD of at least three independent experiments. *P < 0.05, **P < 0.01, ***P < 0.001; treatment vs control. +P < 0.05, ++P < 0.01; combination of TMZ and QMR vs TMZ alone.

