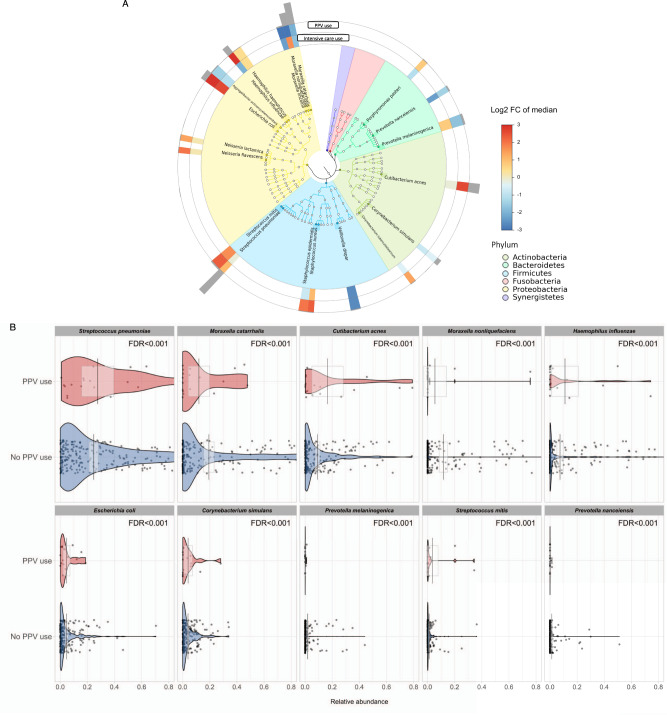
Fig. 3. Relationship of abundant microbial species with the risk of higher severity in infants hospitalized for bronchiolitis.
A Phylogenetic plot of top 20 most abundant microbial species in the nasopharyngeal airway of infants hospitalized for bronchiolitis. The colors in the inner circle annotate the six major phyla. The colors in the two internal rings represent the magnitude of the association between the relative abundance of each species and higher severity (PPV use and intensive care use) outcomes. Greyscale bars on the outside of the circular graph are proportional to the microbial species’ mean relative abundance. B The pirate plots show the comparison of the distribution of ten most abundant species in the nasopharyngeal microbiome in infants hospitalized for bronchiolitis, according to the PPV use. Each point represents each infant. The gray bar and rectangle represent the mean and 95% confidence interval. In the violin plots, the width represents the probability that infants take on a specific relative abundance. The between-group differences in the abundance were tested by fitting Poisson regression models. n = 244 biologically independent samples. Abbreviations: FC fold change, FDR false discovery rate, PPV positive pressure ventilation.

