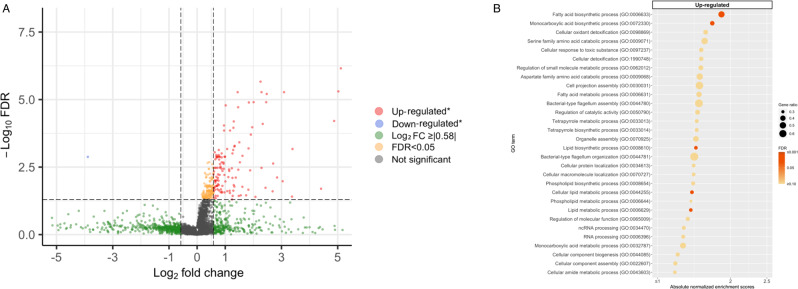
Fig. 4. Differential gene expression analysis of microbial function data with regard to the use of positive pressure ventilation in infants hospitalized for bronchiolitis.
A Volcano plot of differentially expressed microbial transcripts (metatranscriptome). The threshold of log2 fold change is |0.58| (i.e., ≥|1.5|-fold change), and that of FDR is <0.05. There were 129 differentially expressed microbial transcripts that met these criteria. B Gene set enrichment analysis (GSEA) of the metatranscriptome data. We showed 30 microbial functional pathways (GO biological process) with the most significant FDR in the gene set enrichment analysis (GSEA). Downregulated pathways were not detected. We also showed the normalized enrichment score, FDR, and the gene ratio for the corresponding pathways. Abbreviations: FDR false discovery rate; GO gene ontology; GSEA gene set enrichment analysis.

