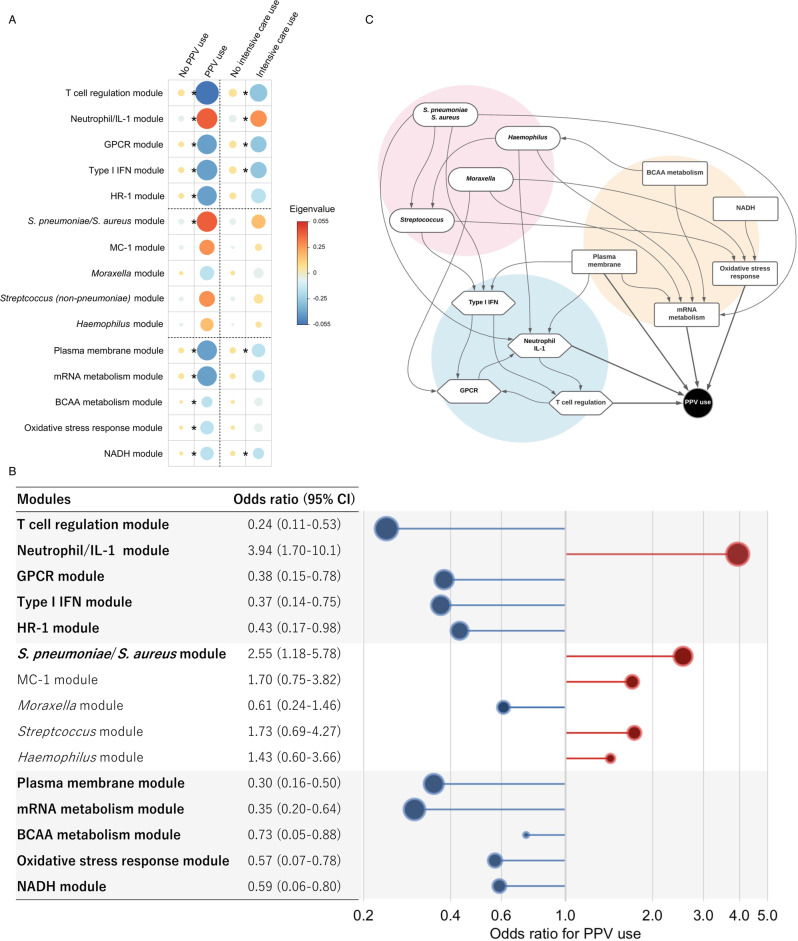
Fig. 5. Integrated associations of the dual-transcriptome modules with the use of positive pressure ventilation in infants hospitalized for bronchiolitis.
A Heatmap of the median eigenvalues (the first principal component) for the corresponding modules in each outcome group. The areas of circles and colors represent the median value of the corresponding eigenvalue. The between-group differences tested using two-tailed t-test s, accounting for multiple comparisons by applying Benjamini–Hochberg false discovery rate (FDR). Asterisks indicate statistical significance (FDR < 0.05). The exact P values and FDR are the following: In PPV use, T-cell regulation, P value = 7.3 × 10⁻⁵, FDR = 0.002; Neutrophil/IL-1, P value = 6.7 × 10⁻³, FDR = 0.014; GPCR, P value = 1.1 × 10⁻², FDR = 0.018; Type I IFN; P value = 7.2 × 10⁻⁵, FDR = 0.014; HR-1, P value = 2.5 × 10⁻², FDR = 0.034; S. pneumonia/S. aureus, P value = 1.3 × 10⁻², FDR = 0.020; MC-1, P value = 1.6 × 10⁻¹, FDR = 0.197; Moraxella, P value = 2.3 × 10⁻¹, FDR = 0.244; Streptococcus, P value = 2.0 × 10⁻¹, FDR = 0.226; Haemophilus, P value = 3.8 × 10⁻¹, FDR = 0.379; Plasma membrane, P value = 1.1 × 10⁻¹⁷, FDR < 0.001; mRNA metabolism, P value = 2.1 × 10⁻⁴, FDR = 0.001; BCAA metabolism, P value = 6.0 × 10⁻³, FDR = 0.014; Oxidative stress response, P value = 6.4 × 10⁻⁵, FDR < 0.001; and NADH, P value = 5.5 × 10⁻⁵, FDR < 0.001. In intensive care use, T-cell regulation, P value = 2.0 × 10⁻³, FDR = 0.030; Neutrophil/IL-1, P value = 6.5 × 10⁻³, FDR = 0.036; GPCR, P value = 1.3 × 10⁻², FDR = 0.036; Type I IFN, P value = 8.7 × 10⁻³, FDR = 0.036; HR-1, P value = 3.4*10−2, FDR = 0.064; S. pneumonia/S. aureus, P value = 3.4 × 10⁻², FDR = 0.064; MC-1, P value = 6.2 × 10⁻¹, FDR = 0.659; Moraxella, P value = 3.4 × 10⁻¹, FDR = 0.422; Streptococcus, P value = 3.9 × 10⁻¹, FDR = 0.448; Haemophilus, P value = 7.4 × 10⁻¹, FDR = 0.739; Plasma membrane, P value = 1.4 × 10⁻², FDR = 0.036; mRNA metabolism, P value = 5.0 × 10⁻², FDR = 0.083; BCAA metabolism, P value = 1.4 × 10⁻¹, FDR = 0.211; Oxidative stress response, P value = 2.0 × 10⁻¹, FDR = 0.278; and NADH, P value = 1.4 × 10⁻², FDR = 0.036. B Integrated relationship of the dual-transcriptome modules with the risk of PPV use in infants hospitalized for bronchiolitis. The adjusted odds ratio for the outcome was estimated per one unit increased in the eigenvalue (the first principal component) of the corresponding module by fitting a multivariable logistic regression model with ridge regularization. The 95% CIs were estimated by a bootstrap method with 2000 replicates. In the model, we adjusted for age, sex, and respiratory virus. Statistically significant modules are in bold. C Causal structural learning is applied to the dual-transcriptomics data. It identifies an underlying causal relationship between these host immune response (blue), microbial species (pink), and microbial function (orange) modules in the niche, and demonstrates it as a directed acyclic graph (DAG). This approach is distinctly different from a co-occurrence network, which can reparent only correlations between variables and is agnostic about their underlying causal relationships. For example, the S. pneumoniae/S. aureus module has direct effects on the microbial-mRNA metabolism module and the host neutrophil/IL-1 and type I IFN modules, which have a subsequent effect on the PPV use. Abbreviations: BCAA branched-chain amino acid, FDR false discovery rate, GPCR G-protein-coupled receptor, HR host response, IFN interferon, IL interleukin, NADH nicotinamide adenine dinucleotide hydrogen, MC microbial composition, PPV positive pressure ventilation.

