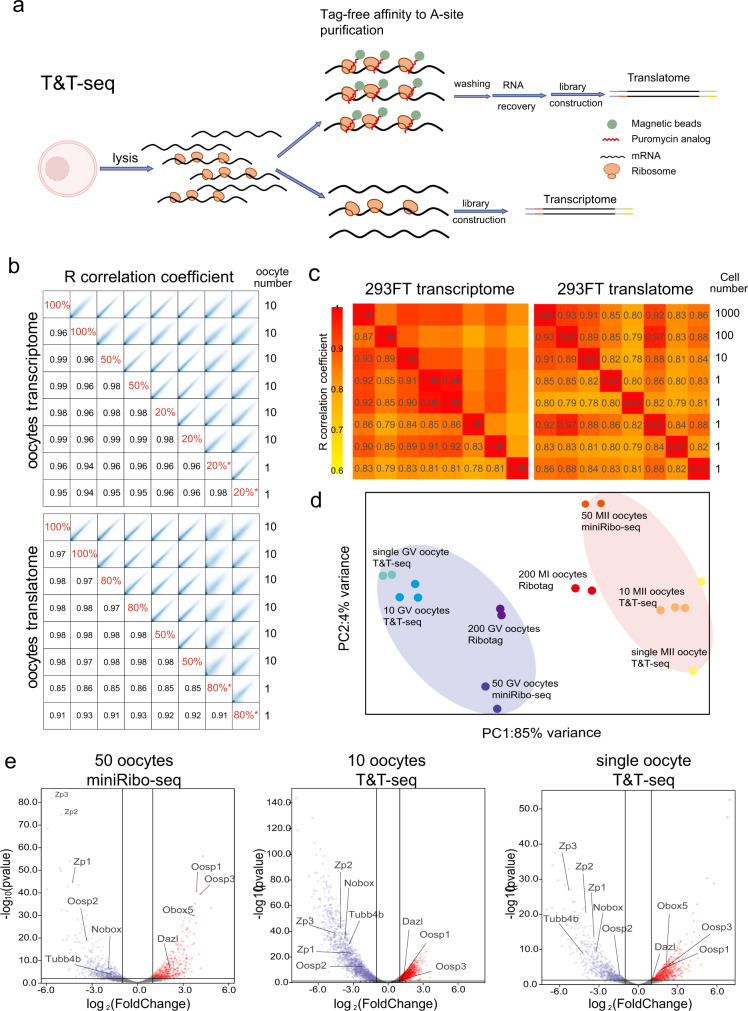
Fig. 1. Transcriptomes and translatomes generated by T&T-seq of mouse single-oocytes and 293FT cells.
a Schematic diagram depicting major procedures and principles of T&T-seq. Created with BioRender.com. b Correlation coefficient of the transcriptome and translatome data from different oocyte lysate ratios and different oocyte numbers, * indicates single-oocyte samples. c Correlation coefficient heatmap of the transcriptomes and translatomes using different number of 293FT cells. d PCA plot of T&T-seq and Ribo-tag (published) sequencing data. Blue area covers GV oocytes and the red area covers MII oocytes. e Volcano plots showing DEGs identified by miniRibo-seq (50 oocytes) and T&T-seq (10 or single oocyte). p < 0.05, wald test, log2 foldchange > 1.

