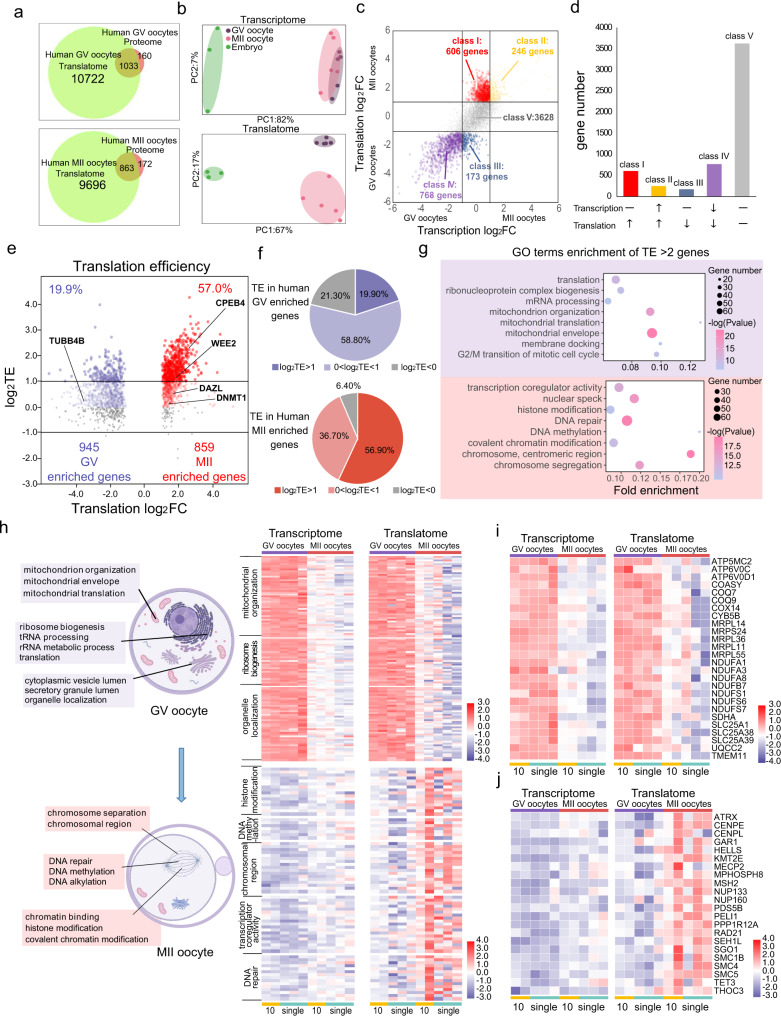
Fig. 2. Distinct transcriptome and translatome patterns of GV and MII human oocytes.
a Venn plot showing the translated gene number using T&T-seq (TPM > 1) and the number of proteins detected in an independent study using 100 oocytes. b PCA plots of different development stages of human oocytes and embryos using T&T-seq. Green area covers morula embryos, purple covers GV oocytes, and pink covers MII oocytes. c Scatter plot showing the DEGs between GV and MII oocytes in transcriptome and translatome (TPM > 1 in both GV and MII oocytes), p < 0.05, wald test, log2 foldchange > 1. Class I (red) denotes genes translationally upregulated in MII translatome but transcriptionally constant in both stages. Class IV (purple) denotes genes with higher translation and transcription in GV oocytes. d Graph showing the number of genes in each class of c. Upward arrow indicates upregulated gene expression of either transcription or translation in MII oocytes. The downward arrow indicates downregulated gene expression of either transcription or translation in MII oocytes. Horizontal line indicates gene expression remains unchanged from GV to MII stages. e Volcano plot showing the translation efficiency (TE) changes from GV to MII stages. TE of each gene is depicted as log2TE in GV and MII oocytes. Red color denotes MII enriched genes. Blue color denotes GV enriched genes. Higher intensity of color indicates gene with higher TE. f Pie charts showing the proportion of different gene groups of TE of e. g Representative GO terms enrichment of TE > 2 (or log2TE > 1) genes. Purple background covers terms enriched in GV oocytes. Red background covers terms enriched in MII oocytes (p-value, hypergeometric test). h Representative GO terms with T&T expression heatmaps contrasting highly translated genes in GV and MII oocytes. Genes expression heatmaps of the same sets of genes and the same set of samples with specific GO terms. Created with BioRender.com. i Expression heatmap showing specific genes enriched in mitochondrial organization and mitochondrial translation GO terms. j Expression heatmap showing specific genes enriched in the chromosomal region and DNA methylation GO terms.

