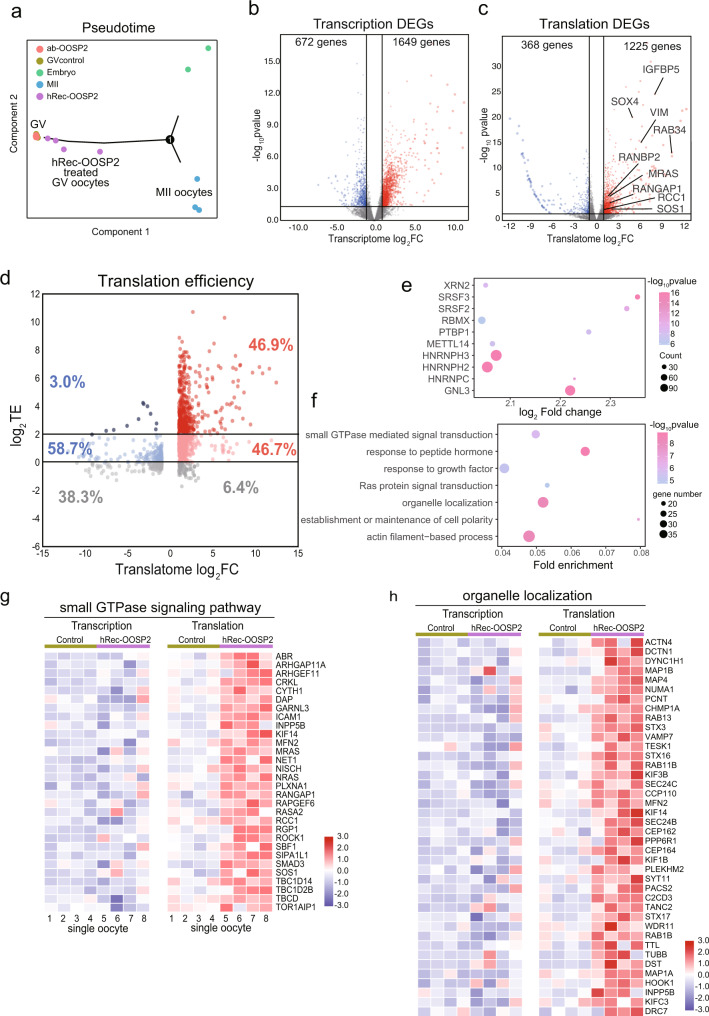
Fig. 7. Single-cell T&T-seq helps to reveal transcriptome and translatome changes after OOSP2 treated human oocytes.
a Pseudotime analysis showing the developmental stages of GV control oocytes, hRec-OOSP2 treated oocyte, ab-OOSP2 treated oocytes, MII oocytes, and morula embryos. b Volcano plot showing transcriptome DEGs of GV control oocytes versus hRec-OOSP2 treated oocyte (p-value, wald test) c Volcano plot showing translatome DEGs of GV control oocytes versus hRec-OOSP2 treated oocyte (p-value, wald test). d Volcano plot showing the TE changes after treated with hRec-OOSP2. TE of each gene is depicted as log2TE of control and hRec-OOSP2 treated oocytes. Red dot indicates upregulated genes in hRec-OOSP2 treated oocytes. Blue dot indicates GV enriched genes. The darker the color, the higher the TE. e Putative RBPs (top10 fold change) identified by 3’UTR motifs of TE > 4 genes after treated with hRec-OOSP2 (p-value, one-sided t-test). f Representative GO terms of TE > 4 genes after treated with hRec-OOSP2 (p-value, hypergeometric test). g, h T&T expression heatmap of the OOSP2 upregulated translational genes involved in small GTPase signaling pathway and organelle localization.

