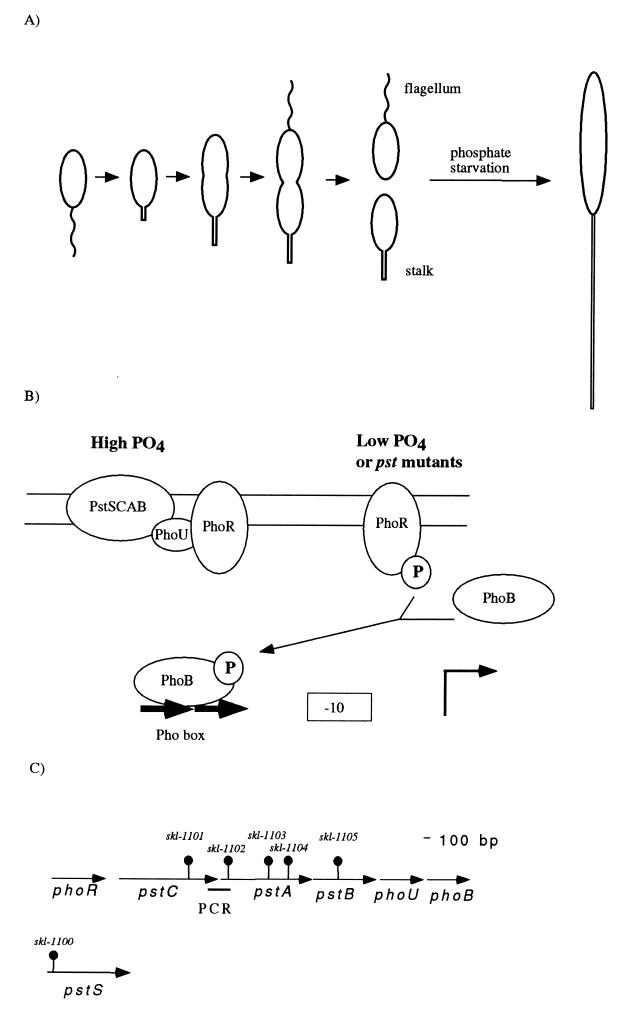
FIG. 1.
Model of the Pho regulon and organization of pst and pho genes of Caulobacter. (A) The Caulobacter life cycle and effect of phosphate starvation. The life cycle of swarmer cells is depicted. The newborn swarmer cell spends an obligatory period of its life cycle as a chemotactically competent polarly flagellated cell unable to initiate DNA replication. Stalk synthesis is initiated at the pole that previously contained the flagellum coincidently with the initiation of DNA replication during the swarmer-to-stalked cell differentiation. The new stalked cell elongates, initiates cell division, and synthesizes a flagellum at the pole opposite the stalk, giving rise to an asymmetric predivisional cell. Cell division yields a stalked cell that can immediately initiate a new cell cycle and a swarmer cell. Phosphate starvation yields elongated cells with long stalks. (B) Model of the Pho regulon. This model is adapted from work with E. coli (52). The PstSCAB proteins form the high-affinity phosphate transport system. When phosphate is in excess, the Pst complex represses the autophosphorylation of the histidine kinase PhoR. PhoU is required to inhibit the expression of the Pho regulon, but is not required for phosphate transport by the Pst system. Deletion of phoU has deleterious effects on growth, and these effects are dependent on phoB (15). When cells are starved for phosphate, the Pst complex releases PhoR, which autophosphorylates and transfers the phosphate residue to PhoB. PhoB∼P binds to the Pho box sequences of promoters (−10 and bent arrow) and activates the transcription of most genes of the Pho regulon. In a few cases, binding of PhoB-∼P represses transcription. We hypothesize that PhoB∼P activates the transcription of a gene or genes whose expression results in an increase in stalk synthesis. (C) Organization of the pst-pho gene cluster. Genes are represented by arrows, and the sites of transposon insertion in the different mutants are represented by “lollipop” structures. The thick line labeled PCR under the region between pstC and pstA indicates the PCR product that was obtained with oligonucleotides from the end of the phoR-pstC sequence contig and the beginning of the pstA-pstB-phoU-phoB sequence contig. The pstS gene is shown below the pst-pho region because it maps to an unlinked locus.

