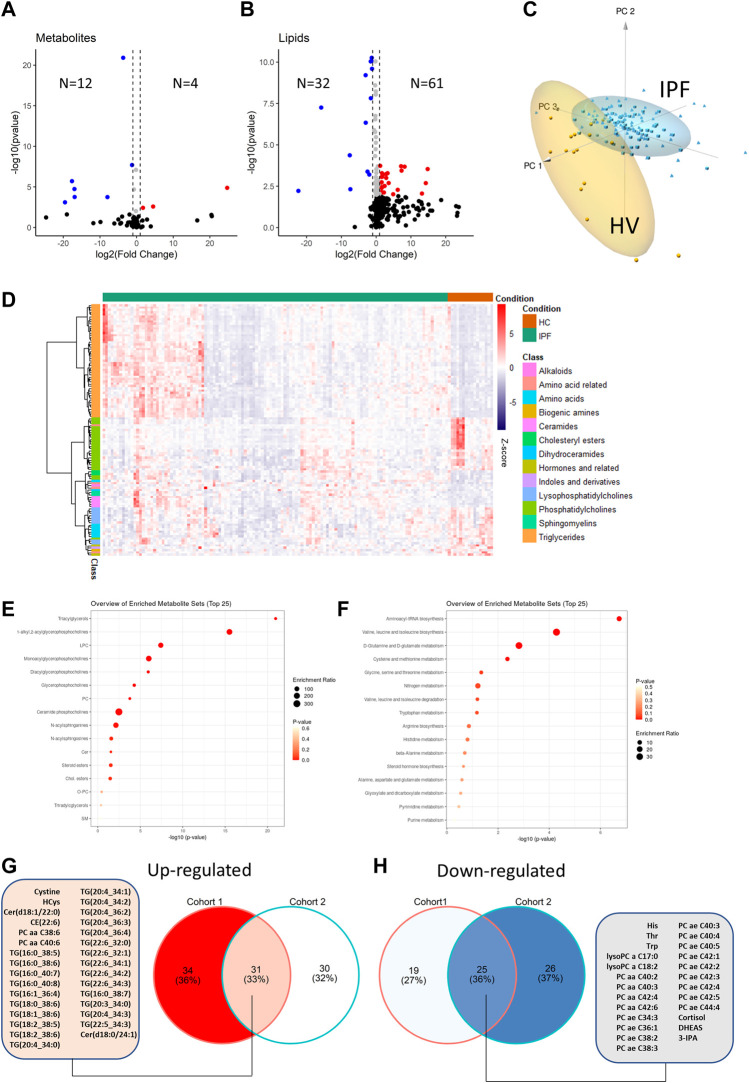
FIGURE 2.
Comparison of metabolite differential abundance between patients with idiopathic pulmonary fibrosis and healthy volunteers. Log2-Fold changes were plotted against -log10 (p-value) of cohort 1 vs. IPF for small molecules (A) and lipids (B) as volcano-plots with numbers of significantly (FDR<0.05) up or down-regulated analytes indicated. Deregulated analytes were scaled and plotted as a 3 days principal component analysis with high lighting of IPF vs. healthy volunteers (HV) clusters (C). De-regulated analytes are plotted as a heatmap with hierarchical clustering of analytes (row-wise) and visualization of abundance by Z-score (D). KEGG IDs (small molecules) or compound names (lipids) were analyzed for pathway enrichment with resulting enrichment ratios and p-values plotted for small molecule pathways (E) and lipid pathways (F). The overlap between de-regulated analytes from the IPF cohort 1 and cohort 2 are shown as Venn diagram in (G) and (H) with a list of common de-regulated analytes.

