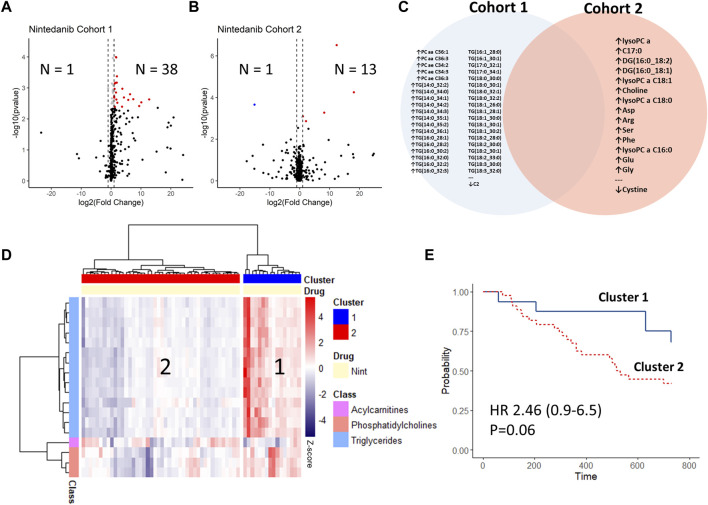
FIGURE 4.
Changes in longitudinal analysis before vs. after initiation of antifibrotic treatment with nintedanib. Log2-Fold changes were plotted against -log10 (p-value) of cohort 1 (A) and cohort 2 (B) as volcano-plots with numbers of significantly (FDR<0.05) up or down-regulated analytes indicated (sample after treatment vs. baseline). The deregulated analytes in both cohorts are shown in (C), with no overlap between the cohorts. Delta-values (sample after treatment vs. baseline) of cohort 1 were calculated per patient and changes between the de-regulated analytes were plotted via heat-map with hierarchical clustering (ward.D method) (D). The resulting patient clusters were then compared via Kaplan-Meier curves and adjusted cox-regression modelling (for GAP-index) (E).

