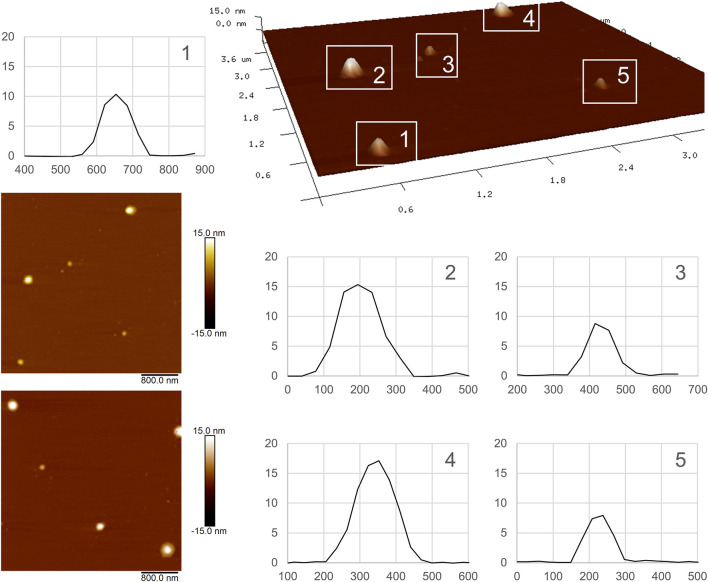
FIGURE 2.
AFM images of NLC-PB. On the left, two independent 2D images are presented. The 3D image corresponds to the upper one. In the size curves, the X-axis has an arbitrary origin, and thus it serves to measure differences (diameters). Attractive forces with the support and weak forces of the probe generate flattening in the analyzed NPs resulting in smaller z particle size.

