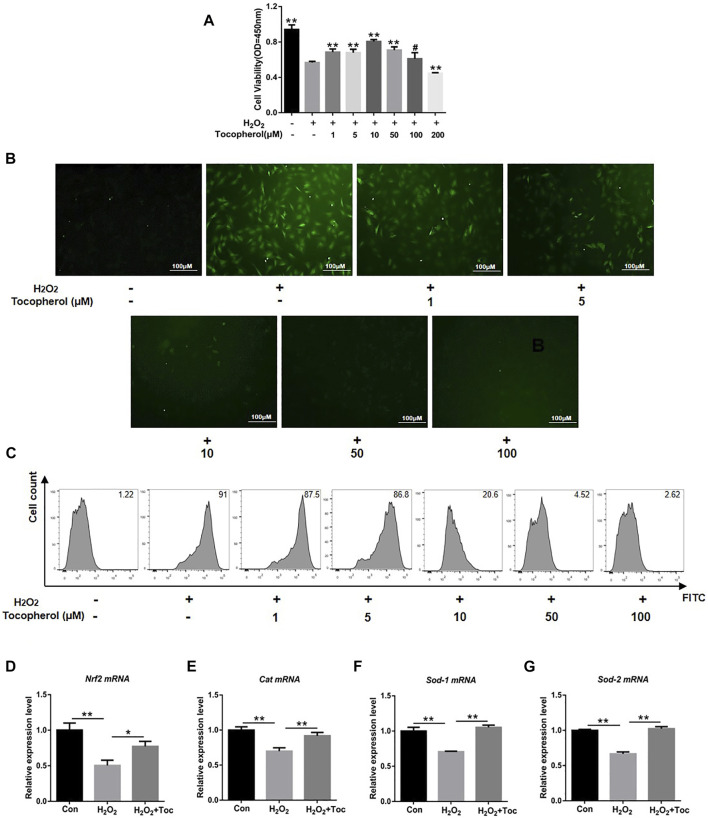
FIGURE 1.
Assessment of the protection of different concentrations of tocopherol in H2O2-stimulated BMSCs. (A) Cell viability of H2O2-stimulated BMSCs after tocopherol (1–200 μM) treatment was detected by the CCK-8 assay. (B) Intracellular ROS measurement was measured by microscopy (scale bar = 100 μM). (C) Intracellular ROS measurement was measured by flow cytometry. (D–G) RT‐PCR analysis measured the ROS level of H2O2-stimulated BMSCs (*p < 0.05; **p < 0.01 vs. the H2O2 group).

